Reading trend structure: higher highs and higher lows
On this page
Before indicators, before patterns, there is structure: the sequence of swing highs and swing lows on a chart. It is the plainest way to say whether a market is trending, and where that reading would be proven wrong.
Swing highs and swing lows
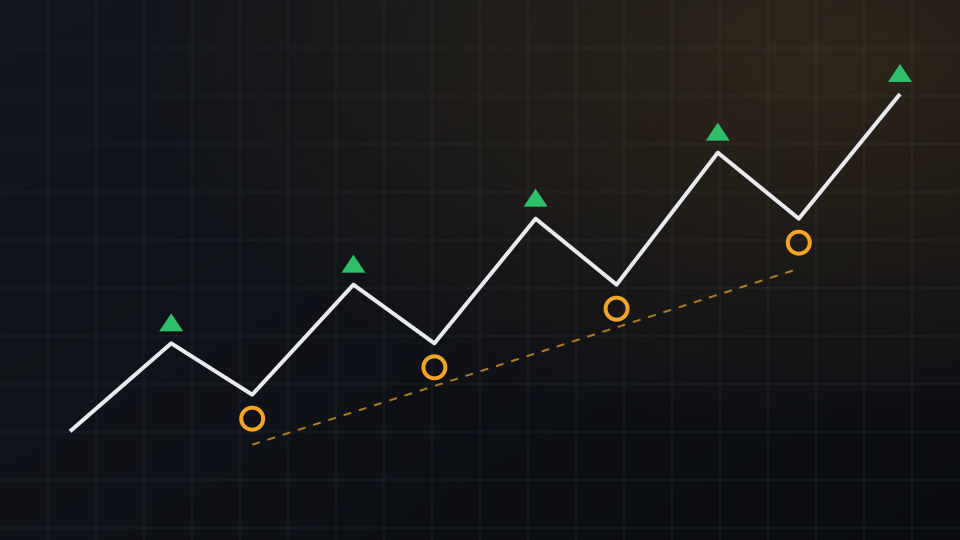
A swing high is a peak with lower prices on both sides; a swing low is a trough with higher prices on both sides. Connect them in order and the chart becomes a zigzag you can describe in words.
The three structures
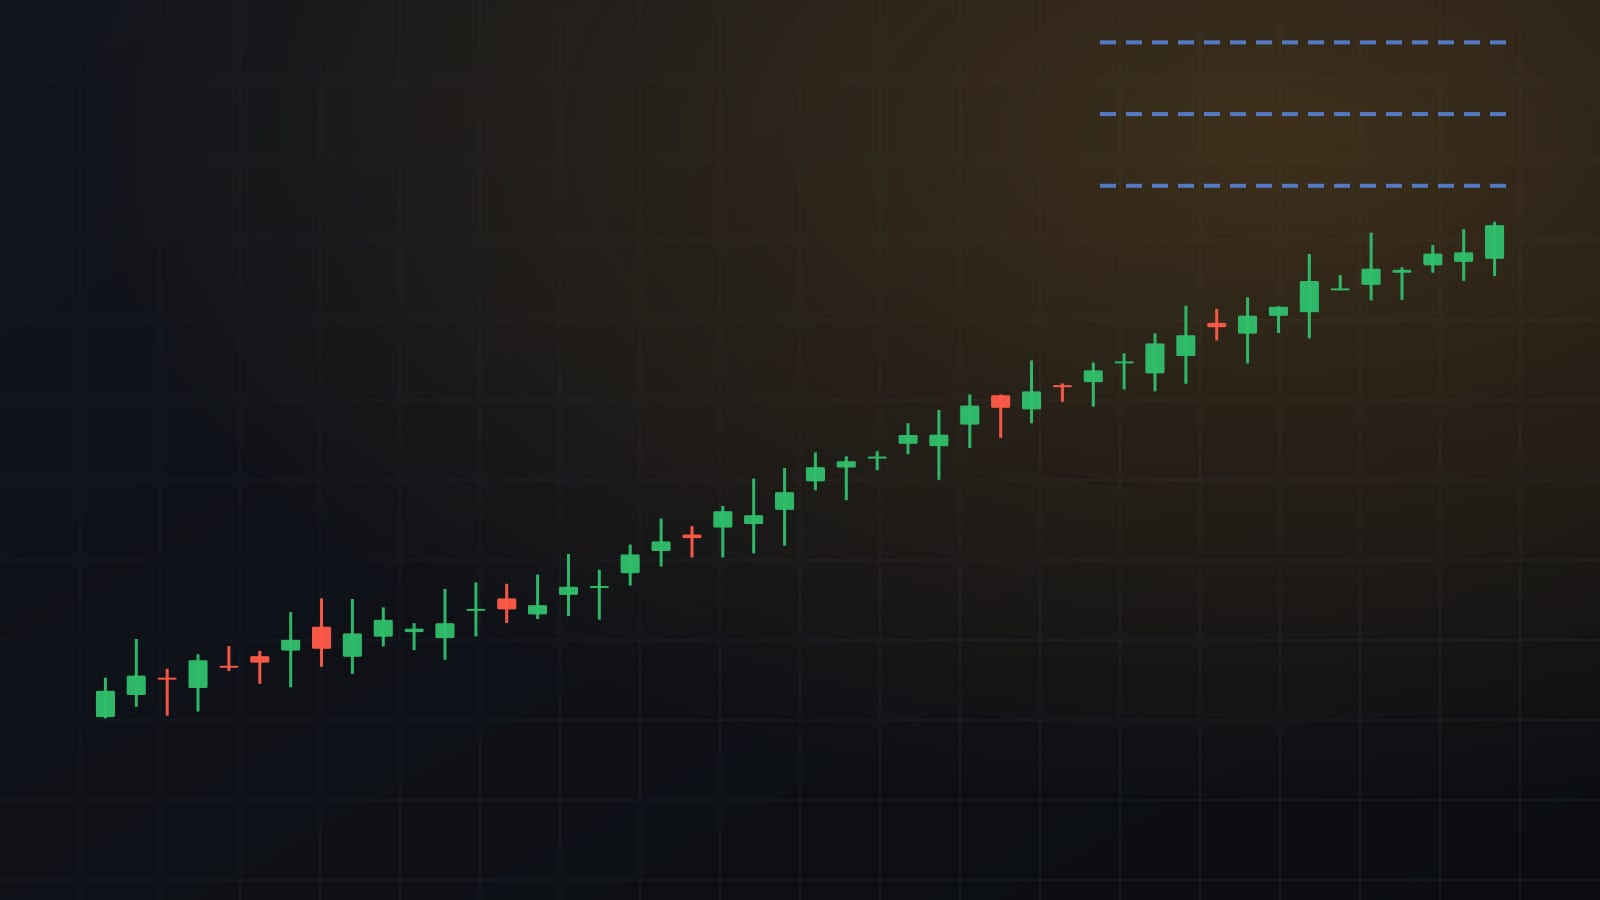
- Uptrend: each swing high is higher than the last (higher highs) and each swing low is higher too (higher lows).
- Downtrend: lower highs and lower lows.
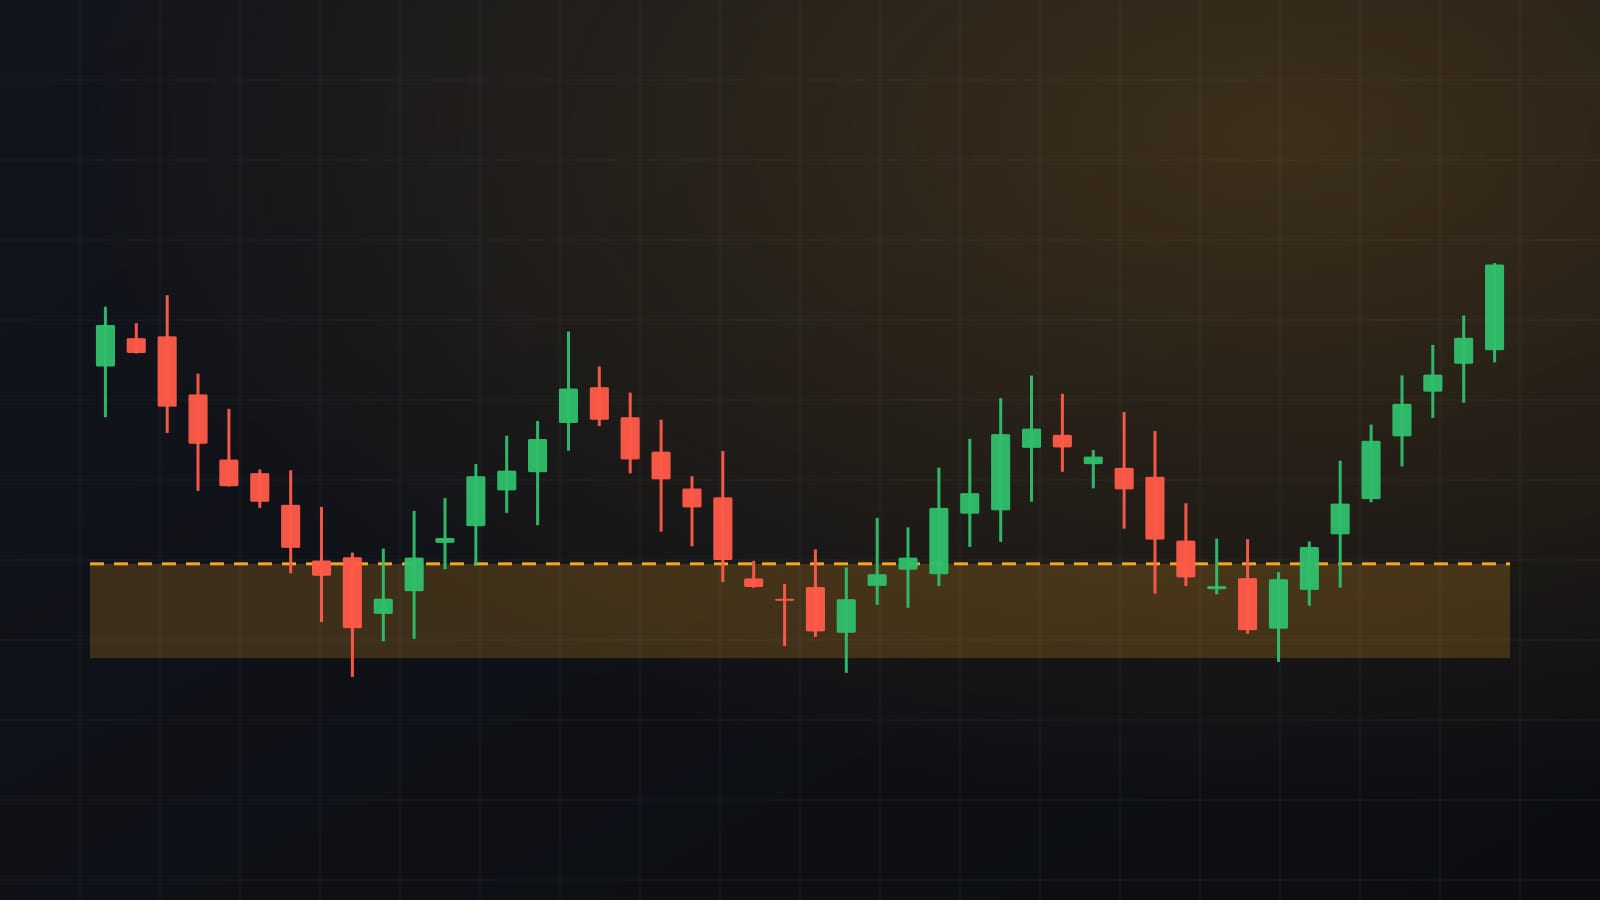
- Range: highs and lows repeat around similar levels, with no clear direction.
Where the trend is invalidated
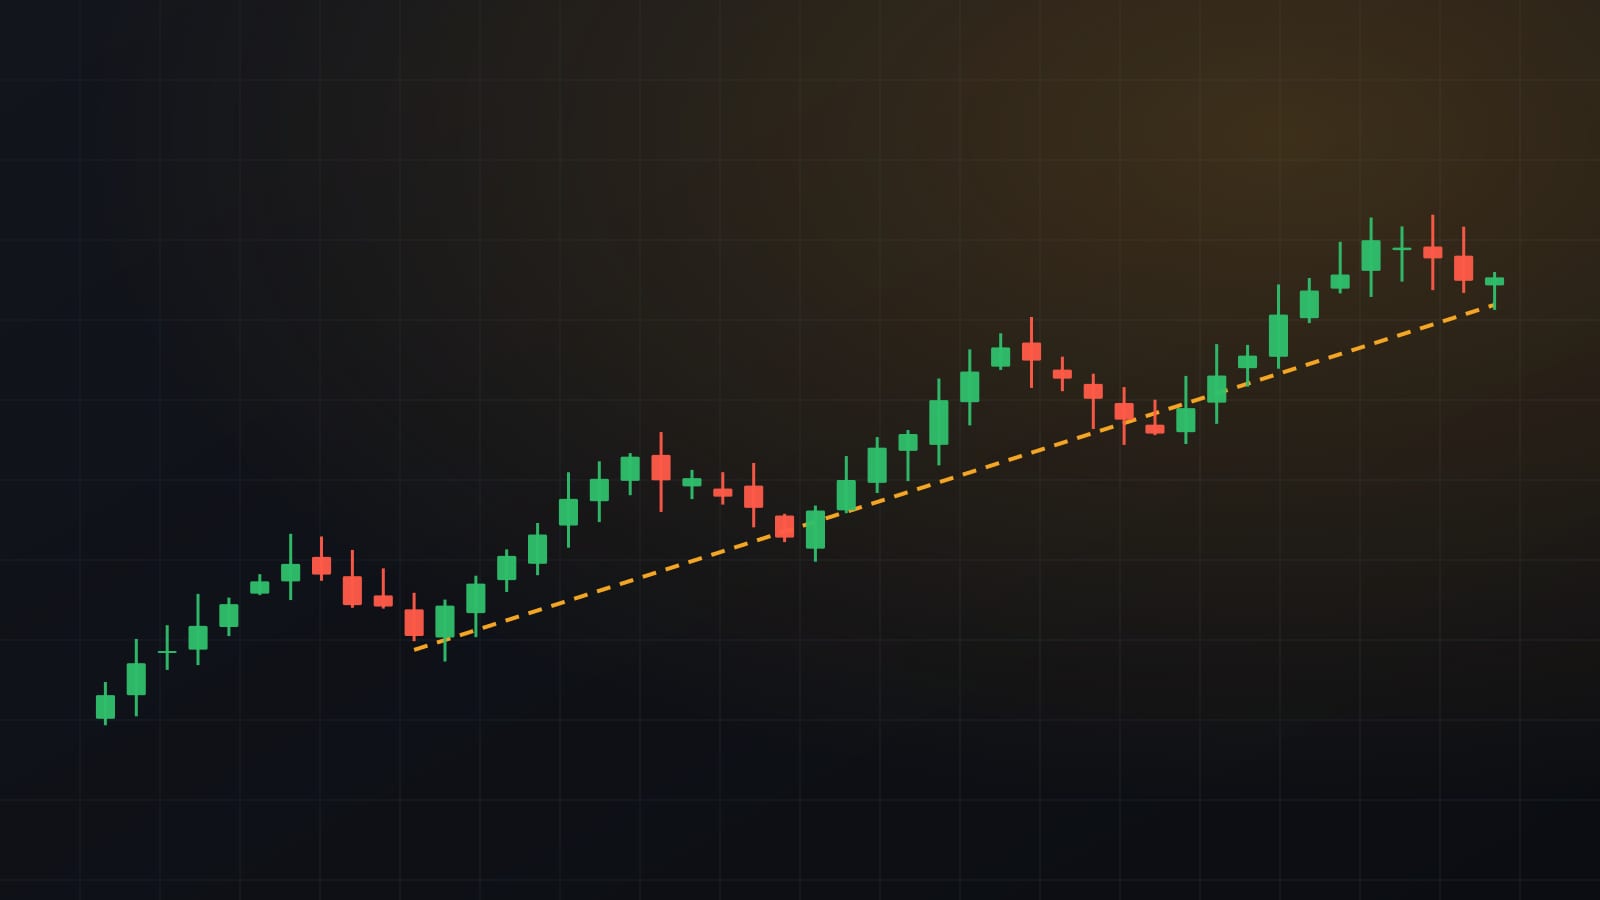
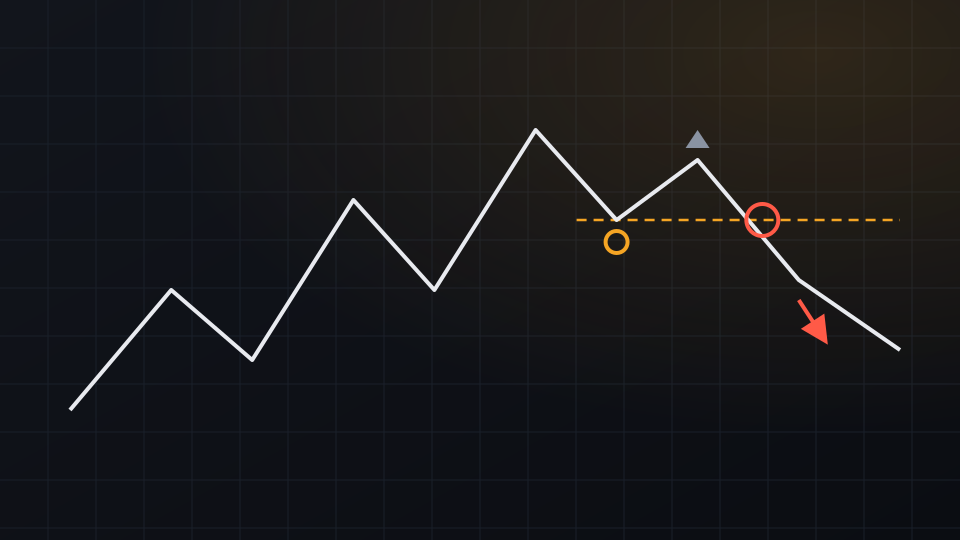
In an uptrend, the most recent higher low is the line in the sand. A close below it means the pattern of higher lows has broken, and the structure is no longer an uptrend. That does not automatically make it a downtrend; it often becomes a range first.
This is also why many traders place their invalidation, or stop, just beyond the last swing low in an uptrend: it marks the point where their reading of the chart is wrong.
Practical tips
- Start on a higher timeframe to find the main structure, then zoom in.
- Ignore tiny wiggles; count only swings that stand out clearly.
- Expect pullbacks inside a trend. A lower close is not a break until it takes out the last swing low.
For education only, not financial advice. Crypto assets and stocks are volatile, and leveraged positions can lose more than the money you put in.
Get one like this every week
A five-minute market brief in your inbox each Monday. Free, unsubscribe anytime.
Or follow the Telegram channel @isoskwllsMarket now
Latest news