Support and resistance: drawing levels that hold up
Support and resistance are the first things most traders draw on a chart. Drawn carelessly, they turn every chart into a mesh of lines. Drawn with a few rules, they show where price has repeatedly changed direction.
What the terms mean
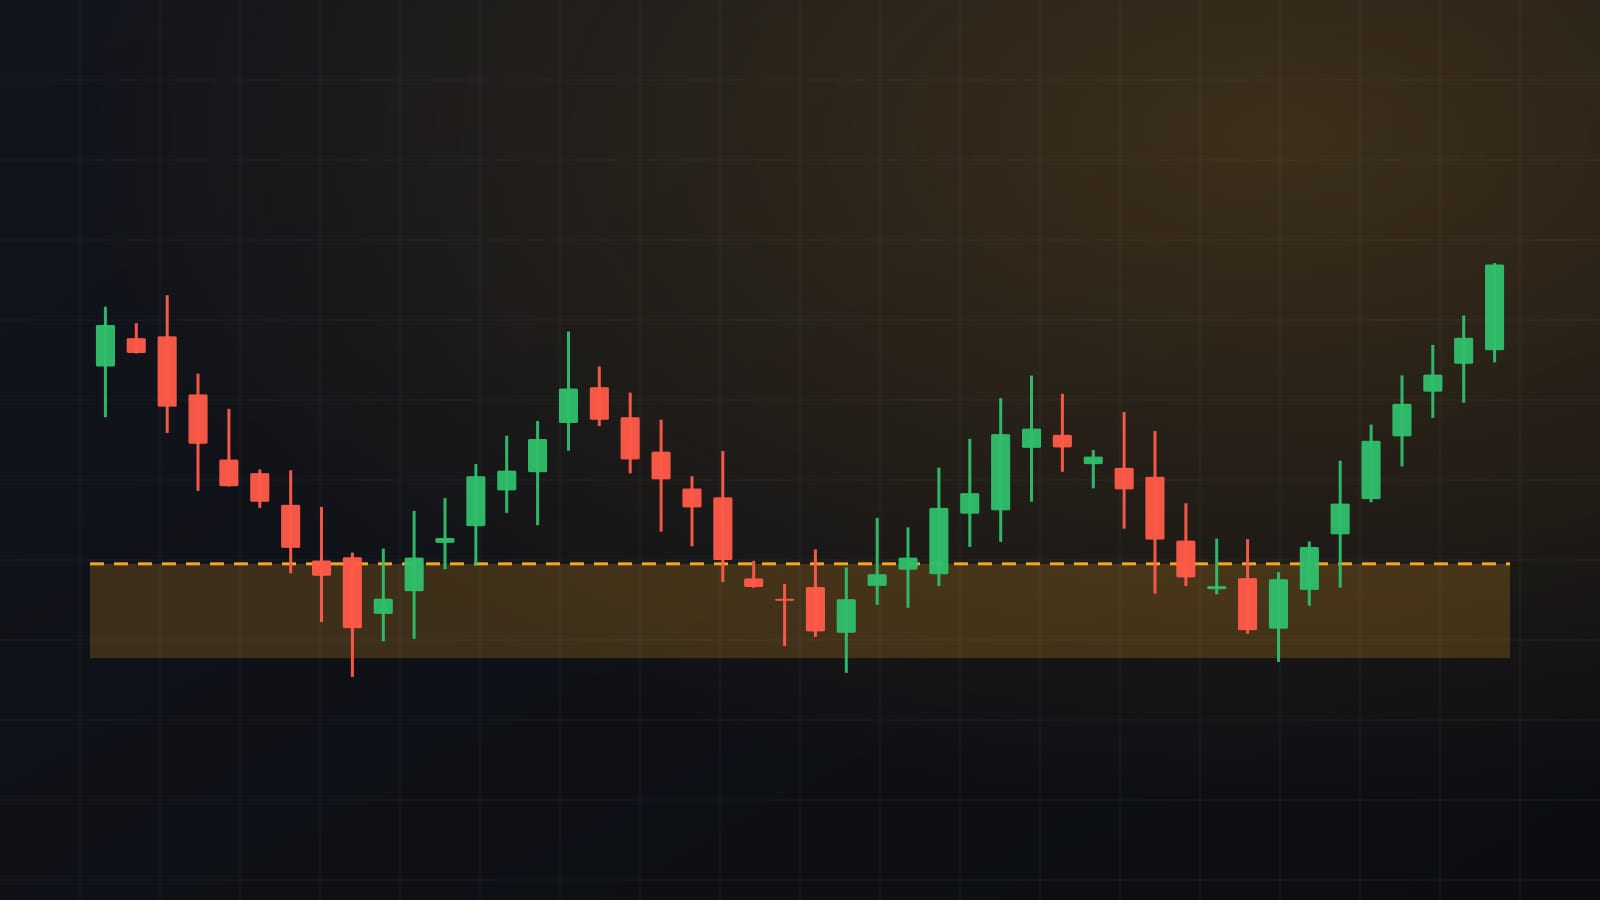
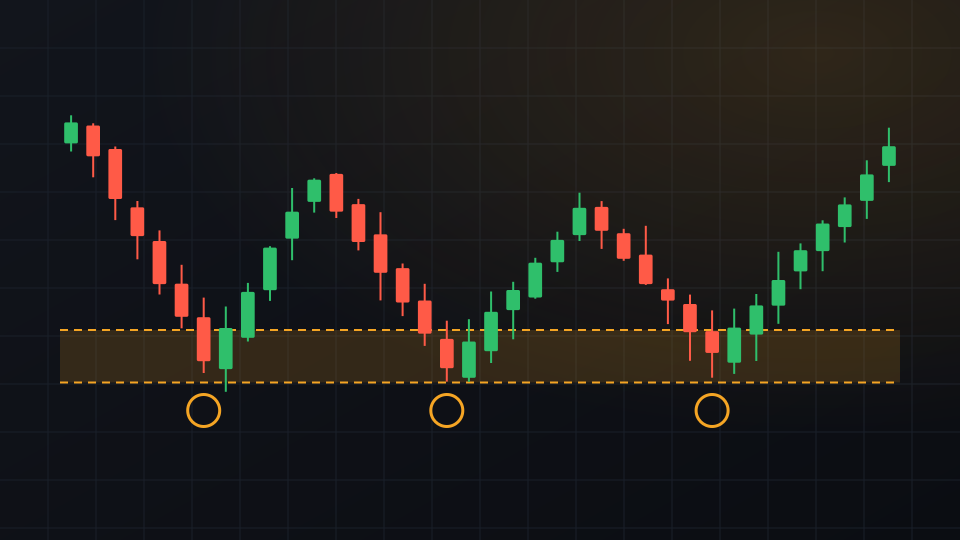
Support is a price area where falling prices have stopped and turned higher more than once. Resistance is an area where rising prices have stalled and turned lower. The idea is simple: when many traders remember a level, their orders tend to cluster around it.
Draw zones, not hairlines
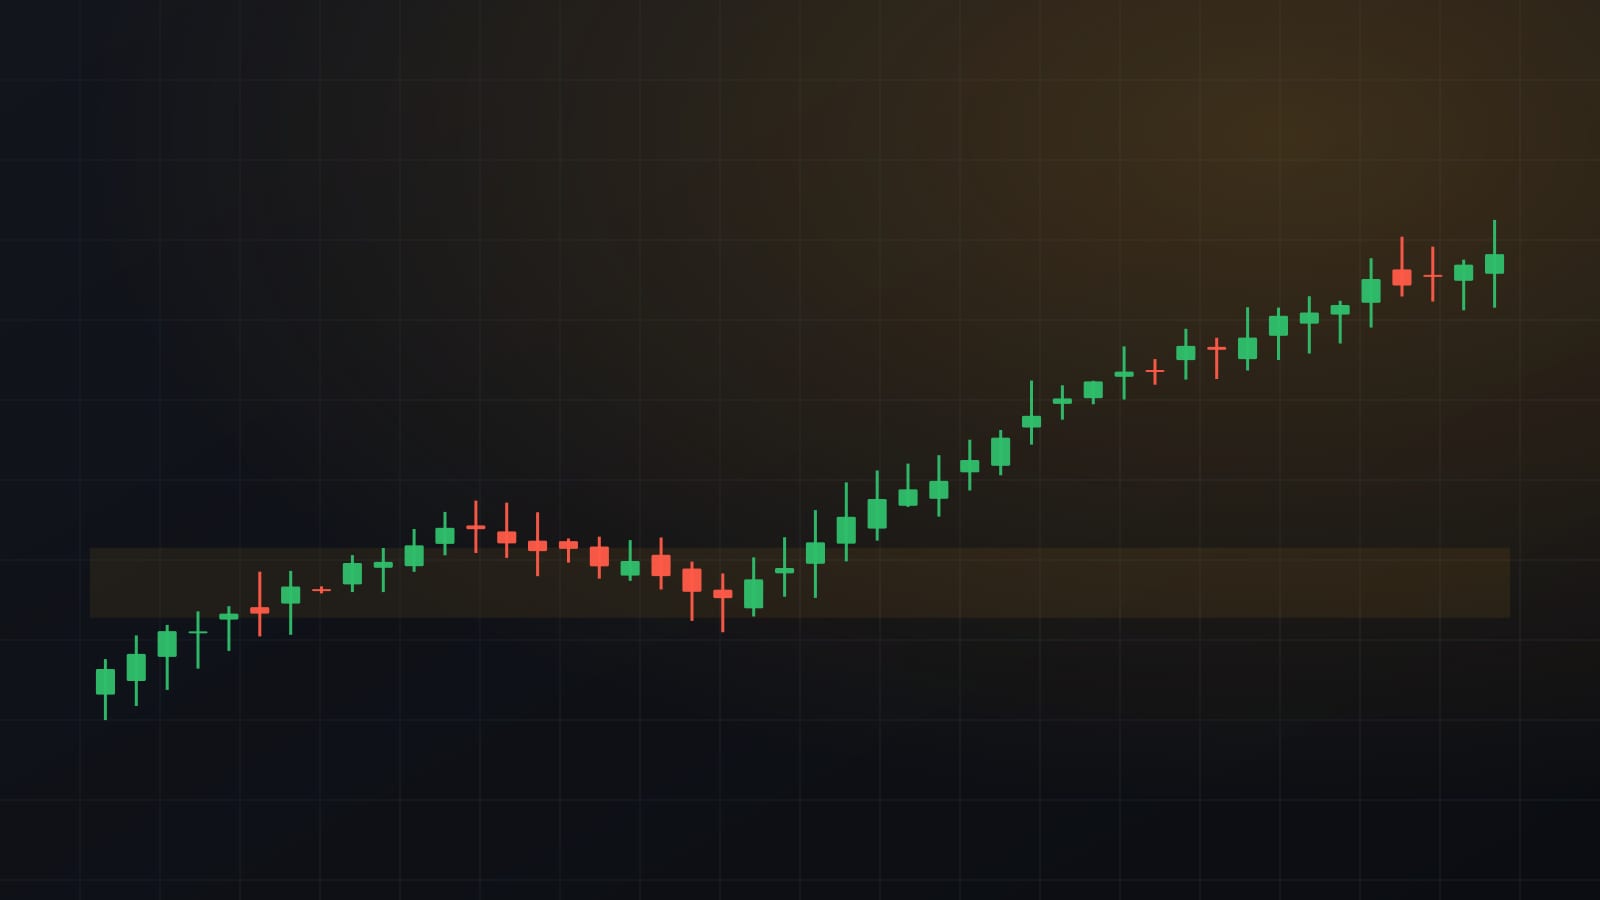
Price rarely turns at exactly the same number. Draw a zone that covers the bodies of the candles where the reversals happened, and treat the long wicks as noise rather than the level itself.
- Use closes first. A daily or 4-hour close below a level is more meaningful than a brief spike.
- Count clear reactions. Two or three sharp turns from the same area make a level worth marking; one touch does not.
- Prefer higher timeframes. A level visible on the daily chart carries more weight than one that only appears on a 5-minute chart.
- Keep it to a few levels. If more than three or four zones fit on the screen, most of them are not important.
When levels break
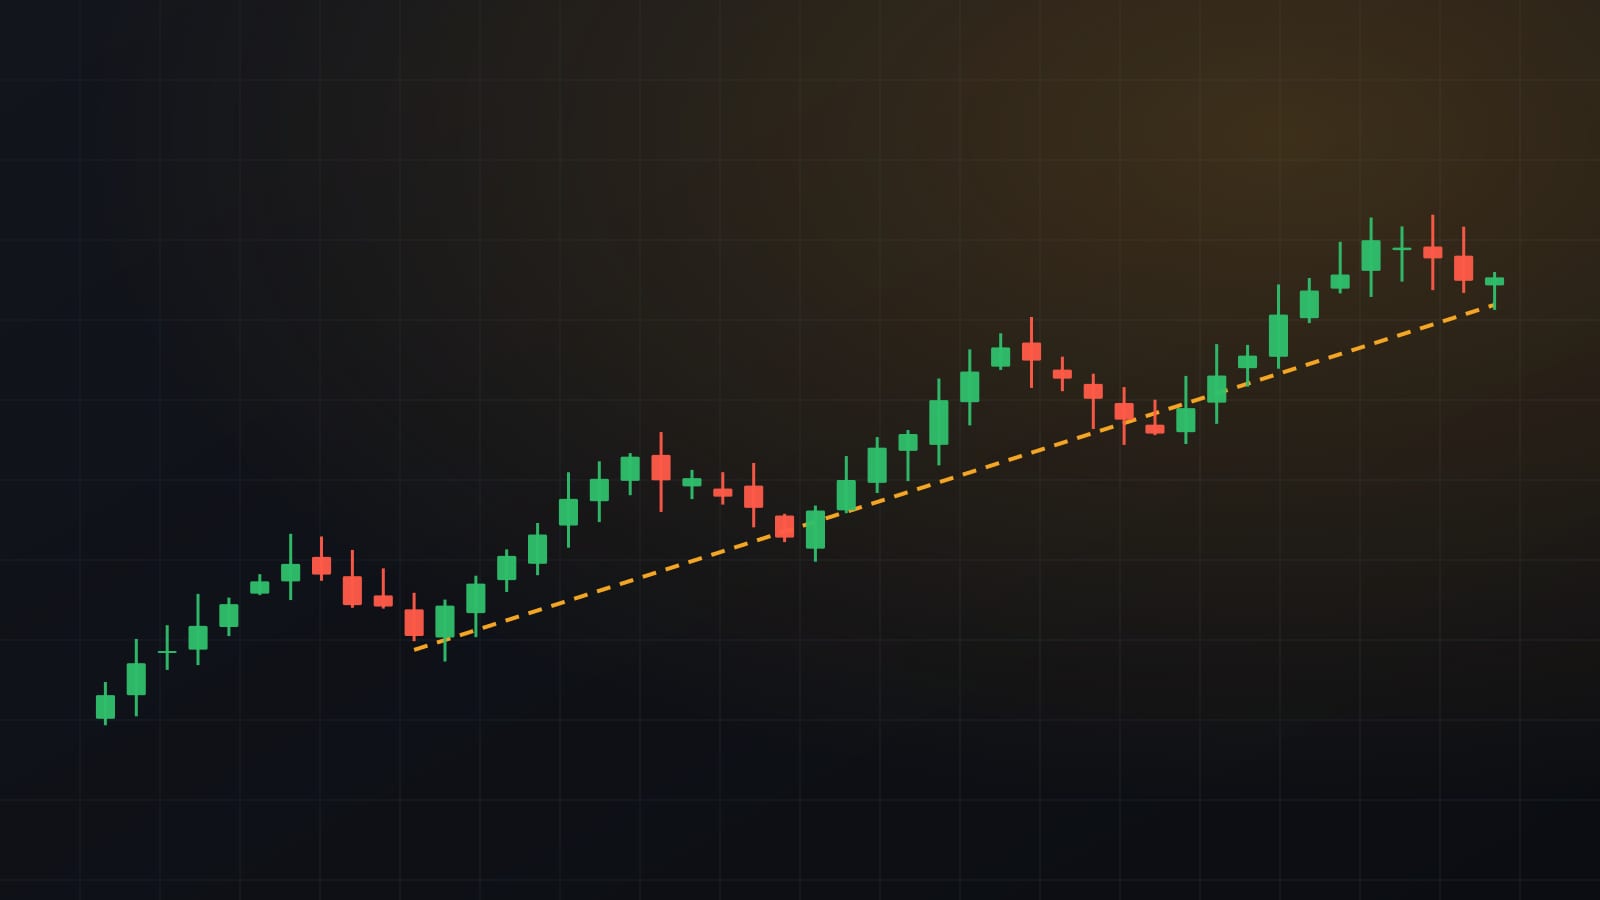
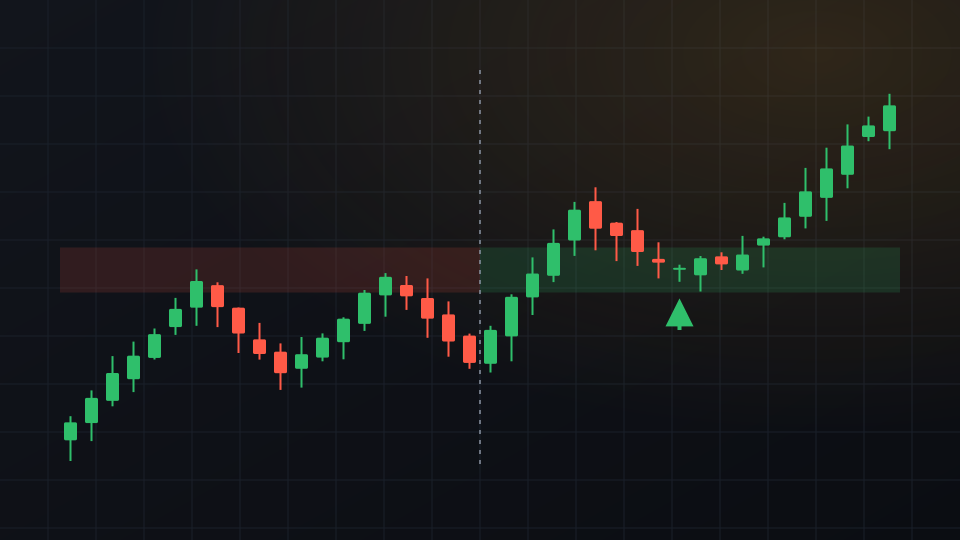
When price closes clearly through a level, the old role often flips: broken resistance can act as support on the next pullback, and broken support can act as resistance. Traders call the return to the level a retest.
A break that quickly reverses back inside the range is a false breakout. It happens often, which is why many traders wait for a close or a retest before treating a break as real.
Common mistakes
- Moving a line after the fact so that it fits the latest candle.
- Treating a level as a guarantee rather than an area where a reaction is more likely.
- Ignoring the bigger trend: support in a strong downtrend breaks more often than support in an uptrend.
For education only, not financial advice. Crypto assets and stocks are volatile, and leveraged positions can lose more than the money you put in.
Get one like this every week
A five-minute market brief in your inbox each Monday. Free, unsubscribe anytime.
Or follow the Telegram channel @isoskwllsMarket now
Latest news