Bitcoin's higher low before CPI: the daily chart

On this page
Bitcoin slipped to $80,953.41 early Tuesday and then turned around to $83,591.79, a 2.24% gain on the day, Decrypt reported. The bounce came one day before the US inflation report. This article checks what the rebound changed on the daily chart, and what it did not.
A dip, a bounce and a calendar
The move followed a rough stretch. According to Decrypt, bitcoin had handed back half of its September gains in the prior week, and traders swapped their October optimism for jokes about a spooky season. Monday's selling carried into early Tuesday before buyers stepped in.
Sentiment cooled rather than broke. The Crypto Fear and Greed Index, a gauge of market mood, read 56 on the day, a neutral score. It had dropped to 53, and it sat at 82, deep in extreme greed, on Aug. 26.
Two outside forces frame the week. US-listed bitcoin ETFs have recorded net outflows of $386.3 million so far in October, according to Decrypt, and outflows mean funds must sell actual coins. Then comes Wednesday's CPI release, expected to show annual inflation at 3.6%, up from 3.4%. Decrypt noted that a hotter print could lift bets on rate hikes and weigh on bitcoin. The Federal Reserve meets on Oct. 27-28.
Why the higher low matters
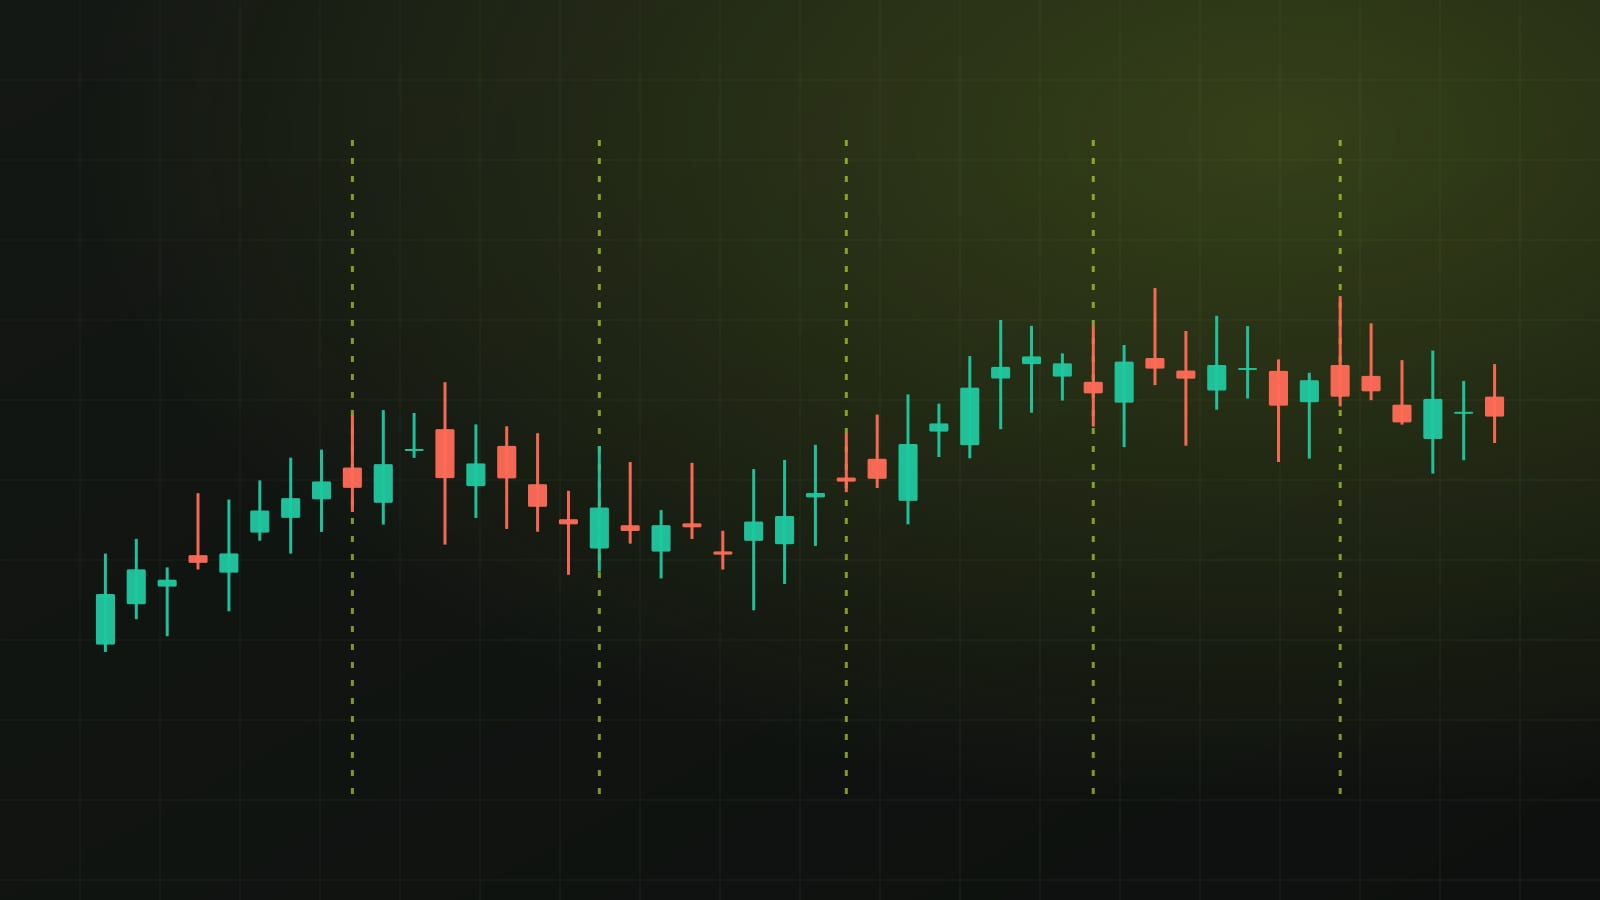
Decrypt's read centres on one detail. Tuesday's low held roughly $588 above the $80,365.12 swing low where the recent bounce began. A swing low is a turning point where price stopped falling and reversed. When a new dip stops above the last one, chartists call it a higher low, and a run of higher lows is one of the marks of an uptrend.
Decrypt also noted that price regained a Fibonacci band running from $81,847.57 up to $82,305.50. Its other gauges were mixed. The ADX, a measure of trend strength, read 29.9 with buyers ahead, down from 42.8 as of Oct. 7, which suggests the trend is coasting rather than gaining force. RSI, a momentum gauge, sat at 53.4, just over its 50 midpoint. The 50-day exponential average stays above the 200-day line, a setup known as a golden cross.
What the chart shows
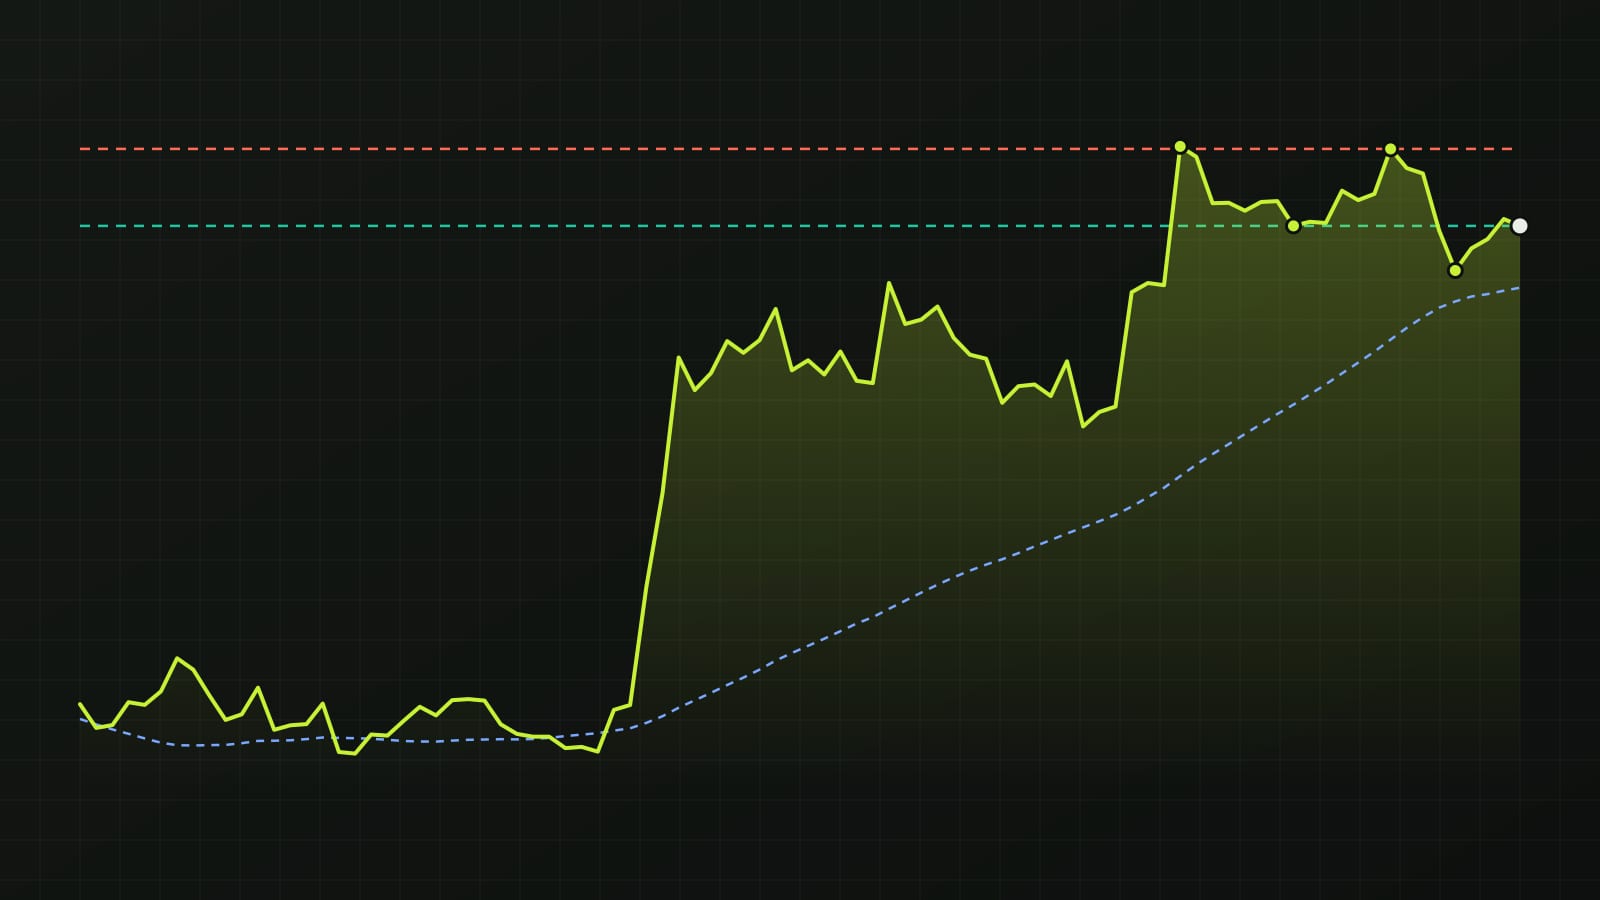
Chartora's own read uses daily closes from Bybit over the last 90 days, and it adds an important qualifier. Bitcoin closed at $83,277. On a closing basis, the structure still counts as a downtrend: the last two swing highs and the last two swing lows are both lower than the ones before. One intraday higher low has not yet turned that sequence around on closes.
The nearest resistance zone sits near $86,518, a swing high from Oct. 4, which is 3.9% above the last close. The nearest support zone is near $81,753, the Oct. 8 swing low, 1.9% below price. That support sits close to the Fibonacci band Decrypt highlighted, so two different methods point to roughly the same area.
Price is above its 50-day simple average of $81,225, by 2.5%. Over 90 days bitcoin is up 30.2%, and it trades 86% of the way from the 90-day low of $62,823 to the high of $86,616. In plain terms: the bigger picture is strong, the recent swings are soft, and price sits in the upper part of its range, not far below the top.
What would change the picture
These are conditions, not forecasts. Treat each level as a zone rather than an exact line.
- A daily close above the $86,518 resistance zone would set a higher swing high on closes and weaken the downtrend reading. Decrypt named $84,245.88 as the first close to watch, then $86,644.19 and the $87,422.70 high.
- Holding the $81,753 support zone on closes would keep the higher low intact and support the uptrend case Decrypt described.
- A daily close below that zone would confirm the lower-low pattern. Decrypt said losing $81,603.02 would bring the trend band near $80,000 into play, and a close beneath it would expose $77,500.
The 50-day average near $81,225 sits just under support. A close below both would mean price had lost its short-term footing, a risk worth keeping in mind with a data release this close.
What to watch next
The CPI print comes first. Decrypt also listed several near-term drivers: news on oil and Iran, moves in Treasury yields, and the ETF flow figures published each day. On the Myriad prediction market, odds that bitcoin touches $80,000 this month were 54%, down from 56% on Monday, while odds of a move to $87,500 stood at 45%. Those odds measure crowd opinion, not probability you can trade on.
Decrypt described the Squeeze Momentum Indicator as active for seven sessions, with a reading of -0.52. A squeeze means volatility has been compressed. Compressed ranges often end with a larger move, but the indicator does not say which way, so the levels above matter more than the label.
Sources
Written with AI assistance from the reports named above and Chartora's own chart data. Figures, quotes and sources are checked automatically before publishing.
For education only, not financial advice. Crypto assets and stocks are volatile, and leveraged positions can lose more than the money you put in.
Get one like this every week
A five-minute market brief in your inbox each Monday. Free, unsubscribe anytime.
Chart notes during the week on Telegram: @isoskwllsMarket now
Latest news