Bitcoin shrugs off ETF outflows: what the daily chart shows
On this page
Bitcoin traded near $84,050 on Monday, according to CoinDesk, after dipping to around $83,500 earlier in the day. The recovery came despite a rough week for US spot bitcoin ETFs. This article sets the flow numbers against the daily chart and asks where price sits relative to the $82,000 support zone analysts named.
What happened
CoinDesk reported that Monday's price was not far from the roughly $84,145 high set on Sunday. The move was broad. Purvang Mashru of BitDelta India told CoinDesk that nine of the top ten digital assets advanced over the last 24 hours, with Avalanche leading, up 5.1% to $10.91.
The macro backdrop eased slightly. WTI oil futures fell 1.8% to $90.28 at the start of the week, undoing a Thursday spike. CoinDesk linked the drop to a Friday announcement by President Donald Trump of a deal for Russia to deliver 300,000 metric tons of diesel, a partial easing of sanctions.
Why the ETF numbers matter
Spot ETF flows are one of the clearest views of institutional demand. Last week was weak. Citing SoSoValue data, CoinDesk said US spot bitcoin ETFs had $681 million of outflows, the largest since June, mostly on Wednesday and Thursday.
Decrypt's tracker shows the same pattern day by day. Wednesday brought a $484.9 million exit and Thursday another $244.1 million, before Friday added $21.1 million back. October had opened well, with $292.6 million of inflows on Oct. 1 and 2 and $118.8 million on Oct. 6. Even so, Decrypt reported a net loss of $386.3 million over the month's first seven sessions.
Context helps. In September, after a failed Senate cloture vote on the Clarity Act, bitcoin ETFs logged a nine-session inflow run worth roughly $3 billion, Decrypt noted. Since launch, cumulative net inflows stand at $57.6 billion, with $100.6 billion in total net assets. One bad week is small against that base, but it shows demand is not one-directional.
Ether funds fared worse. Decrypt reported that ether ETFs lost $56.1 million on Friday, a ninth straight day of outflows, and $635 million so far in October.
What the bitcoin chart shows
Chartora's data uses daily closes. Bitcoin's last daily close was $83,482, a little below the intraday prices quoted above. That gap is normal: a close is one snapshot per day.
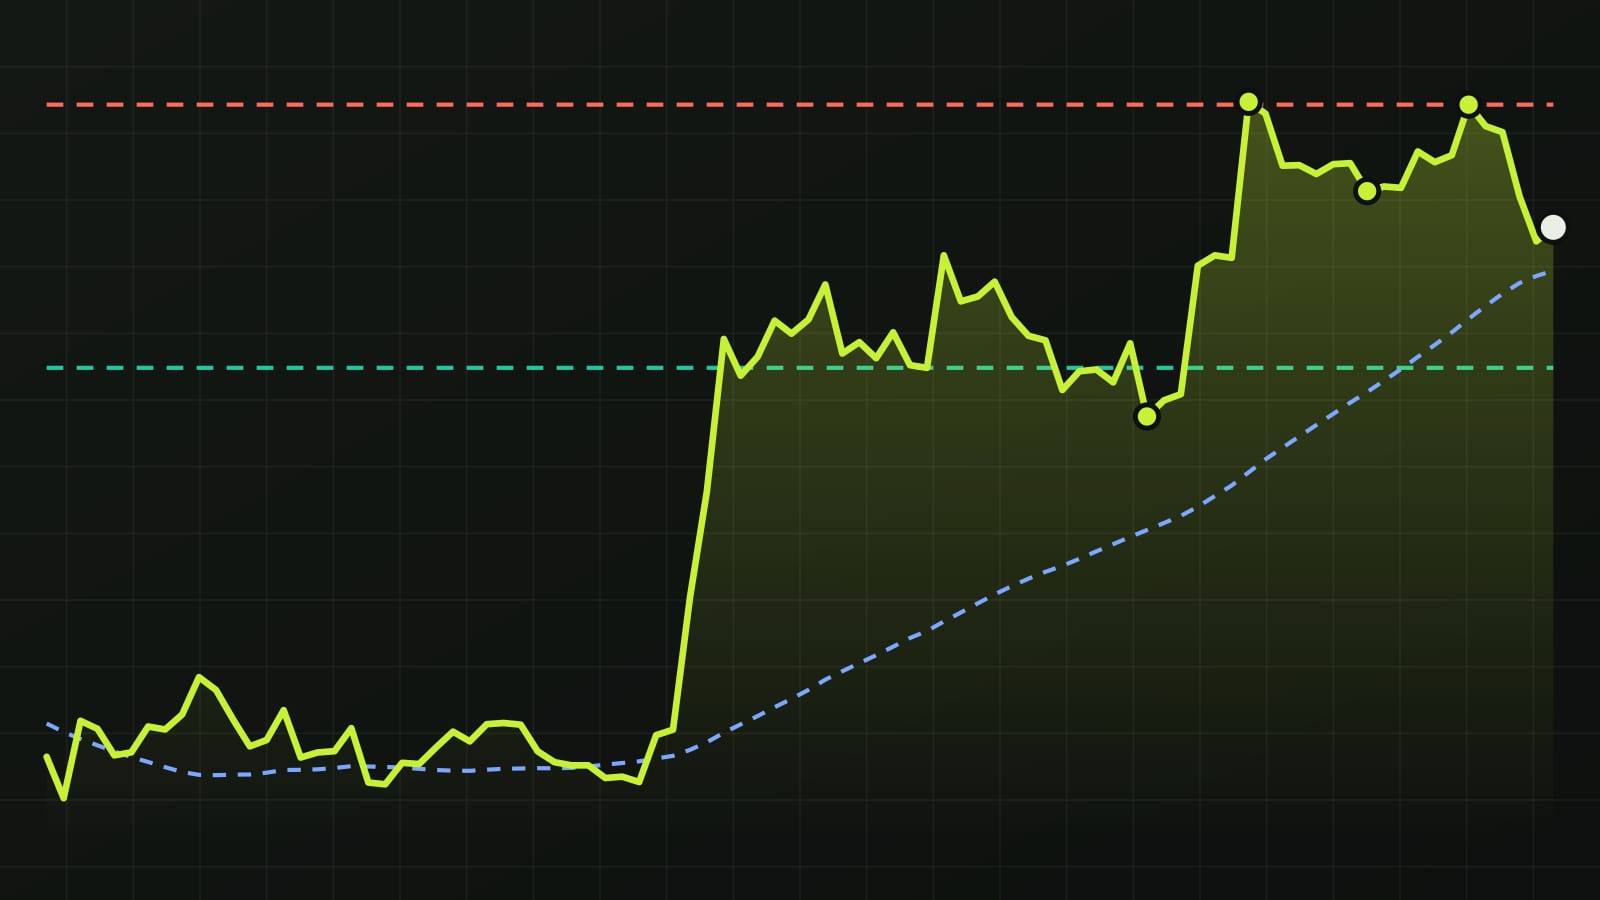
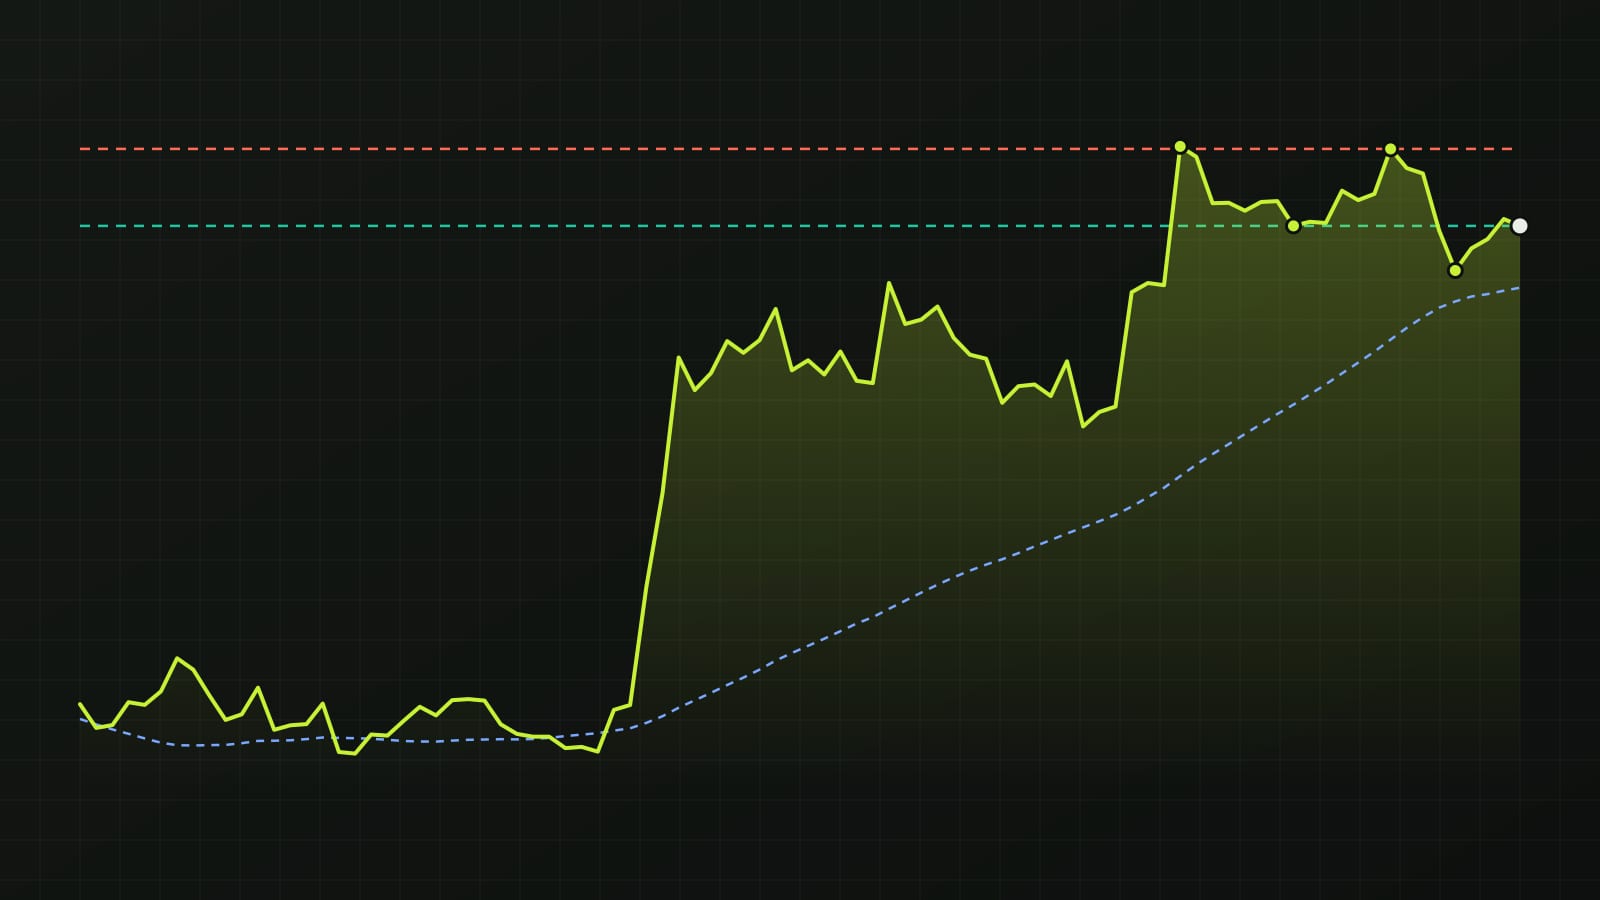
Nearest support sits at $81,753, a swing low from 2026-10-08, about 2.1% below price. A swing low is a close lower than the closes around it. This zone lines up closely with the $82,000 level that both Mashru and Vikram Subburaj, CEO of Giottus Exchange, called key support. Nearest resistance is $86,518, a swing high from 2026-10-04, about 3.6% above price.
Trend structure is still a downtrend on daily closes, meaning lower highs and lower lows. Price, however, is above its 50-day average of $81,079 by 3.0%. The 50-day average is the mean of the last 50 daily closes and shows the medium-term direction. Bitcoin is up 28.9% over 90 days and sits 87% of the way from its 90-day low of $62,823 to its high of $86,616.
Ether in brief
Ether's last daily close was $2,556, also in a downtrend on daily closes. It sits just below its 50-day average of $2,559, by 0.1%. Support is at $2,475, about 3.3% below; resistance is at $2,727, about 6.7% above. Ether is 76% of the way through its 90-day range of $1,842 to $2,776.
What would change the picture
For bitcoin, a daily close below the $81,753 to $82,000 zone would weaken the current reading and put the 50-day average in question. A daily close above $86,518 would break the pattern of lower highs and challenge the downtrend label. Between those zones, the chart is mixed: a falling structure, but price above its medium-term average.
Treat these as zones, not exact lines. Volatile flows can push price through a level intraday without a close beyond it.
What to watch next
Both analysts pointed to US inflation figures due Oct. 14 as the next major macro catalyst. Mashru also noted that Treasury yields touched 24-year highs in the week ending 9 October. Daily ETF flows remain the other signal. As Subburaj put it, "ETF flows remain volatile."
Sources
- CoinDesk · October 12, 2026
- Decrypt · October 11, 2026
Written with AI assistance from the reports named above and Chartora's own chart data. Figures, quotes and sources are checked automatically before publishing.
For education only, not financial advice. Crypto assets and stocks are volatile, and leveraged positions can lose more than the money you put in.
Get one like this every week
A five-minute market brief in your inbox each Monday. Free, unsubscribe anytime.
Chart notes during the week on Telegram: @isoskwllsMarket now
Latest news