Funding Rates Explained: How Perpetual Futures Track Spot
On this page
Crypto perpetual futures never expire, so something else has to keep their price close to the spot market. That something is funding: a regular payment between traders who are long and traders who are short. Funding rates appear in a lot of market coverage, so it helps to know what they measure and what they do not.
What a perpetual contract is
A traditional futures contract has an expiry date. On that date it settles against the price of the underlying asset, so the two prices are pulled together as expiry approaches. A perpetual contract, or perp, has no expiry. A trader can hold a position for as long as there is enough margin to support it.
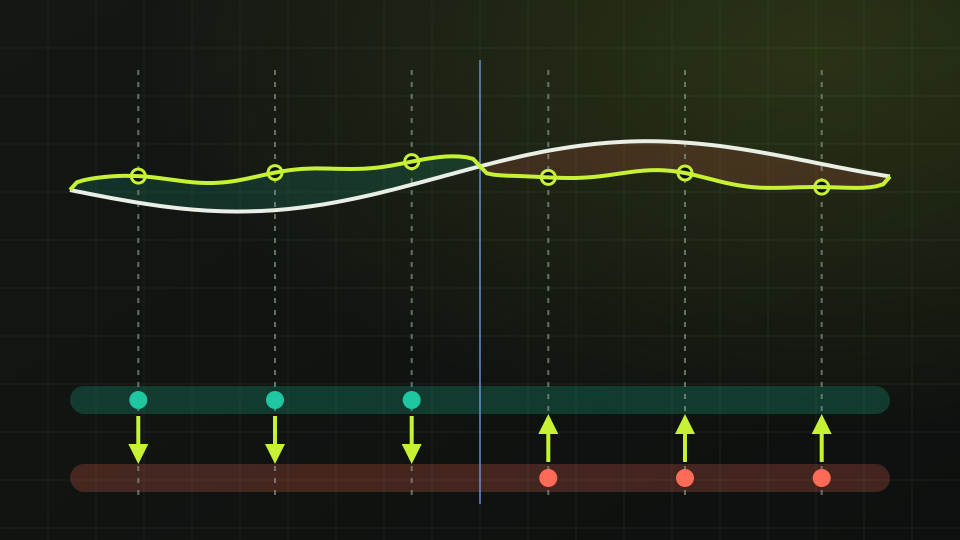
Without an expiry, nothing forces the perp to meet the spot price. Funding does that job. Exchanges compare the perp price with an index price, usually a weighted average of spot prices from several exchanges, and set the funding rate from the gap between them.
Who pays whom
Funding is paid between traders who hold open positions. On most major exchanges it passes from one side to the other rather than to the exchange.
- Positive funding: the perp trades above the index. Longs pay shorts. Holding a long becomes more expensive and holding a short more attractive, which tends to pull the perp back down.
- Negative funding: the perp trades below the index. Shorts pay longs, which tends to pull the perp back up.
- Who is charged: only positions open at the funding time pay or receive. The payment is the position’s value multiplied by the rate, not the margin posted.
Exchanges usually calculate the rate from the gap between the perp and the index, sometimes with a small fixed interest component, and many cap how far it can go in one interval. Each exchange publishes its own formula.
Intervals, and turning a rate into a yearly figure
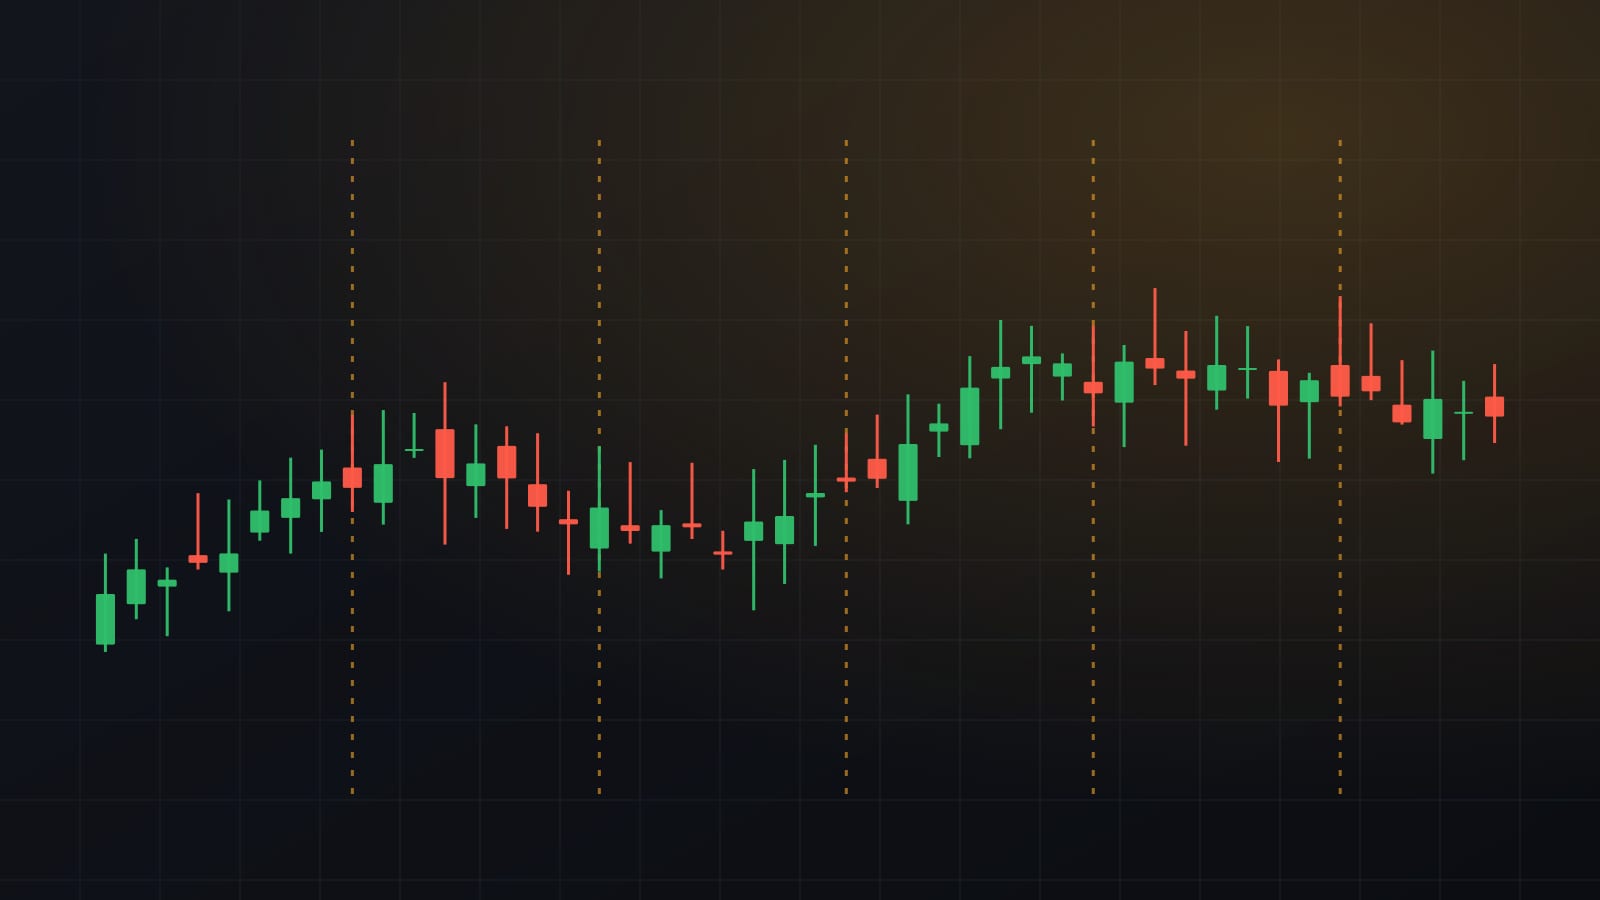
Many major exchanges settle funding every eight hours, three times a day. Some contracts settle every four hours or every hour, and an exchange can change the interval for a contract. Check the interval before comparing two rates.
The quoted rate is per interval. To compare it with other costs, multiply it out. Assume a funding rate of 0.03% per eight-hour interval on a $10,000 long position:
- Each interval, the long pays $10,000 × 0.03% = $3.00.
- Three intervals a day make 0.09%, or $9.00 per day.
- Over 365 days that is 32.85% a year, or $3,285.00 on the same position.
A rate that looks small can be large on a shorter interval. A rate of 0.01% per hour is 0.24% a day and 87.6% a year, far more than 0.03% every eight hours.
The yearly figure is a simple multiplication that assumes the rate never changes. In practice it is recalculated every interval, so treat an annualised number as a snapshot, not a forecast.
What extreme funding can and cannot tell you
A high positive rate shows that traders are willing to pay a lot to stay long: demand for leveraged long exposure is strong relative to short exposure. A deeply negative rate shows the reverse.
- It can tell you which side is crowded, and how expensive it is to keep holding that side.
- It can tell you that positioning is one-sided, which is when liquidations can speed up a move against the crowded side.
- It cannot tell you when that positioning will unwind. Funding can stay high for long periods while price keeps moving the same way.
- It cannot tell you how large the positions are. A high rate in a small market is not the same as a high rate in a large one.
Rates also differ between exchanges and between contracts on the same coin, so one reading from one venue is only part of the picture.
Reading funding with open interest
Funding shows which side is paying; open interest shows how much is at stake. As our guide to open interest explains, it counts the contracts that are still open. Together they describe both the direction and the size of leveraged positioning.
- Open interest rising while positive funding climbs: new leveraged longs are joining and paying more to hold their positions.
- Open interest falling as funding returns toward zero: leveraged positions are being closed and the imbalance is fading.
- High funding with flat open interest: existing positions are one-sided, but they are not growing.
Perpetual contracts use leverage. Leveraged positions can be liquidated quickly, and funding is a cost that keeps adding up for as long as a position stays open on the paying side.
For education only, not financial advice. Crypto assets and stocks are volatile, and leveraged positions can lose more than the money you put in.
Get one like this every week
A five-minute market brief in your inbox each Monday. Free, unsubscribe anytime.
Or follow the Telegram channel @isoskwllsMarket now
Latest news