Trading Volume Explained: What It Confirms and What It Doesn’t

On this page
Volume is the bar chart under most price charts. It shows how much traded, which helps judge how much participation sits behind a move. It does not show direction, and in crypto the number itself depends on where you look.
What volume counts
Volume is the amount traded during a period: shares for a stock, coins for a crypto pair, contracts for futures. Some platforms show it in dollars or another quote currency instead.
Every trade has a buyer and a seller, so a volume bar is not “buying” or “selling” volume. On most charts the bar is simply coloured like its candle: green if the candle closed up, red if it closed down.
Volume is easiest to read against its own recent average. Example (hypothetical): if a stock’s average daily volume over the past 20 sessions is 1,200,000 shares, a day with 3,000,000 shares is 2.5 times the average, and a day with 900,000 shares is 0.75 times.
Why crypto volume depends on the venue
In US stocks, trades from exchanges and off-exchange venues are reported to a consolidated tape, so most charts show a broadly complete total. Data feeds still differ, and a chart built from a single venue’s data shows less.
Crypto has no consolidated tape. Each exchange reports its own trades, so the volume under a chart from one exchange is only that exchange’s share of the market. Aggregated views add several venues together, and each data provider chooses which ones to include.
- Spot and derivatives are separate. Spot volume counts coins changing hands; futures and perpetual volume counts contracts, often traded with leverage. For major coins, derivatives volume is commonly larger than spot volume.
- Reported volume is not always genuine. Some exchanges have inflated their figures with wash trading, trades with no real change of ownership. Data providers apply their own filters, which is one reason their totals differ.
- Units matter. Volume counted in coins and volume counted in dollars move differently when the price changes a lot.
- Time matters. Crypto volume is often lighter at weekends, and US stock volume tends to be heaviest near the open and the close.
Breakouts, drifts and news spikes
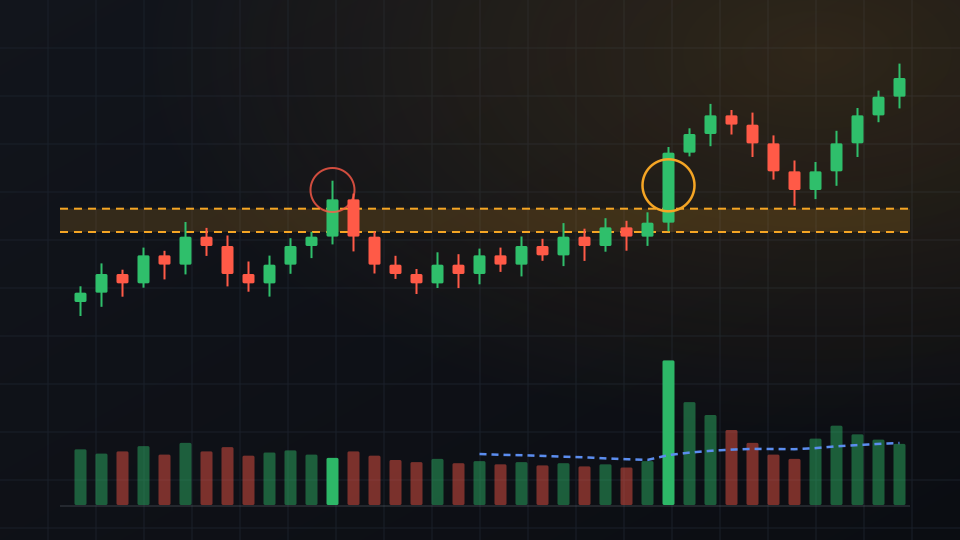
Traders most often check volume when price moves through a level. A break on volume well above the recent average is commonly read as broad participation. A break on light volume is treated with more caution, because little participation stands behind it.
Slow drifts work the other way. A gradual rise or fall on shrinking volume suggests few participants are pushing it. That does not make the drift wrong; it only means volume is not confirming it.
Spikes around news, such as earnings, economic data or an exchange listing, show attention, not direction. In crypto, a wave of liquidations can produce a spike too. Traders often mark the high and low of a spike candle as reference levels afterwards.
Using volume with support and resistance
Volume adds detail to the levels described in our support and resistance guide. A common way to read it at each stage:
- At a test of the level: heavy volume on a rejection shows that a lot of trading happened there, one reason traders treat the level as important.
- On the break: a close beyond the zone on above-average volume is the combination many traders look for.
- On the retest: a pullback to the broken level on lighter volume is commonly read as a calm retest rather than a rush to exit.
- Inside the range: volume that fades as price moves between the edges is normal and says little on its own.
None of these is a rule. Volume makes a reading of the chart stronger or weaker; it does not decide it, and it says nothing about where price goes next.
For education only, not financial advice. Crypto assets and stocks are volatile, and leveraged positions can lose more than the money you put in.
Get one like this every week
A five-minute market brief in your inbox each Monday. Free, unsubscribe anytime.
Or follow the Telegram channel @isoskwllsMarket now
Latest news


