Bitcoin after its biggest ETF outflow since June: what the daily chart shows
On this page
US spot Bitcoin ETFs recorded a net outflow of $484.9 million on Wednesday, October 7, the largest single day since June 25. Bitcoin’s price had already turned lower from the top of its range. Here is what the flow number means, and what the daily chart says about where price now sits.
The flow, in proportion
According to Farside Investors data reported by Cointelegraph, BlackRock’s IBIT lost $207.7 million that day, Fidelity’s FBTC $105.1 million and ARK 21Shares’ ARKB $101.7 million. The day before, the funds had taken in $118.8 million.
Large as it sounds, one day is a small slice of the total. Decrypt puts cumulative net inflows into the funds at $57.8 billion, so Wednesday’s outflow equals about 0.8% of everything that has flowed in since launch. The June 25 outflow it is being compared with was larger, at $691.7 million.
As our guide on ETF flows explains, flow figures are published after the US close, so they describe a move that has already happened. They are more useful as a streak than as a single day.
Where price sits on the daily chart
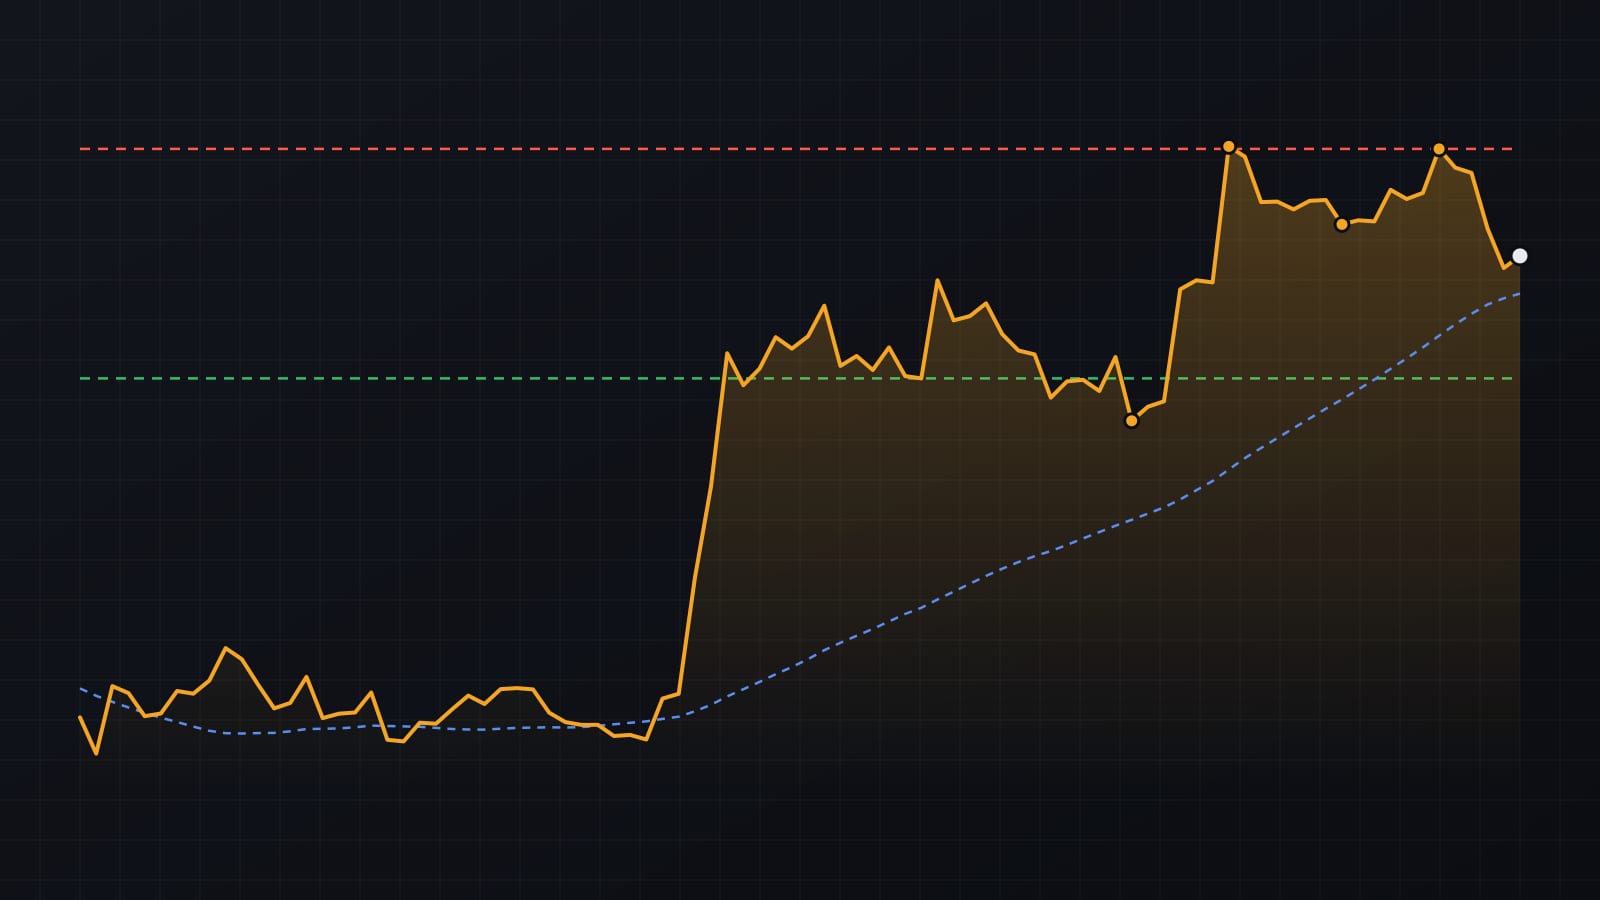
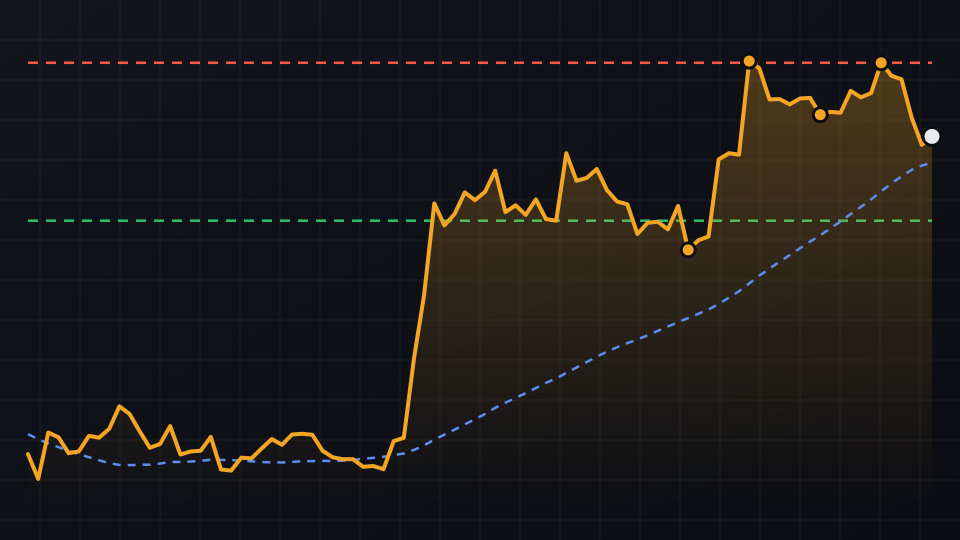
On daily closes (Bybit, UTC), Bitcoin ended October 4 at $86,518, then closed lower on each of the next four days: $85,766, $85,557, $83,325 and $81,753 on October 8. That is a fall of 5.5% from the October 4 close.
We mark levels the same way every time: a swing high is a close higher than the four closes on either side, a swing low is lower. Over the last 90 days that gives the following picture.
- Resistance near $86,500. Two swing highs sit almost on top of each other: $86,616 on September 21 and $86,518 on October 4. Price failed to close above that area twice.
- The latest swing low has given way. The September 28 swing low at $83,500 was a higher low than September 15 ($75,645). The October 8 close of $81,753 is below it.
- Next support near $77,300. The nearest swing low still below price is the September 2 close at $77,340, about 5.7% under the October 8 close.
- The 50-day average is close. On October 8 the 50-day average of closes was about $80,500, roughly 1.5% under that day’s close. Bitcoin has not closed below it since August 16.
Reading the two together
The outflow day and the price drop line up, but the order matters. Price had already stalled under the twin highs before Wednesday, and the flow was reported once the move was under way. The flow confirms that some ETF holders stepped back; it does not show who sold first.
What the chart adds is structure. With a slightly lower high (by about $100) and the latest higher low now broken, the swings no longer describe an uptrend. On our method that reads as a range, roughly $77,300 below and $86,500 above, with price near the middle of it.
What would change the picture
- A daily close above about $86,600 would clear both swing highs and put a higher high back on the chart.
- A close below the 50-day average (about $80,500) would leave price under its medium-term mean for the first time since mid-August.
- A close below $77,340 would break the nearest support, the bottom of the current range.
- A run of outflow days would say more than one day. Two or three in a row while price sits under resistance is worth more attention than a single headline number.
None of these is a prediction. They are the points where the description of the chart would have to change.
Sources
For education only, not financial advice. Crypto assets and stocks are volatile, and leveraged positions can lose more than the money you put in.
Get one like this every week
A five-minute market brief in your inbox each Monday. Free, unsubscribe anytime.
Or follow the Telegram channel @isoskwllsMarket now
Latest news