How to Read a Candlestick Chart: Open, High, Low and Close

On this page
A candlestick chart packs four prices for each period into one small shape. Once you can read that shape, most other chart tools make more sense. It is also easy to read too much into a single candle.
Four prices in one candle
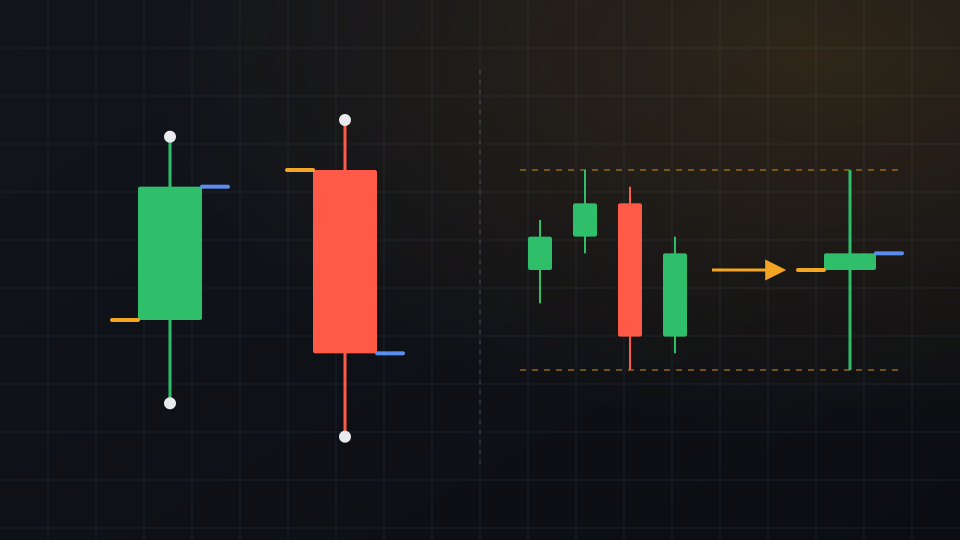
Each candle covers one period of time, such as an hour or a day. It records four prices: the open (the first trade of the period), the high, the low and the close (the last trade). Charting tools often shorten this to OHLC.
The thick part is the body, drawn between the open and the close. The thin lines above and below it are the wicks, also called shadows, and they reach to the high and the low. When the close is above the open, the candle is usually drawn green or hollow; when it is below, red or filled. The colours are a display setting, not part of the data.
Reading the body and the wicks
The body shows the net move from open to close. The wicks show how far price travelled beyond that range during the period before coming back.
Example (hypothetical): a daily candle opens at $100, trades as low as $92 and as high as $104, and closes at $102. The body is $2, the upper wick is $2 and the lower wick is $8. The full range is $12, and two-thirds of it is lower wick.
In words: at some point in the day price traded well below the open, then recovered to close 2% above it. That describes what happened during the day. It is not a forecast of the next one.
Timeframes and the daily close
Shorter candles combine into longer ones. Four 6-hour candles make one daily candle, using the first open, the highest high, the lowest low and the last close. A 5-minute chart shows detail that a daily chart smooths away, so the same market can look calm on one timeframe and busy on another.
Crypto trades around the clock, so a daily “close” is a convention rather than the end of a session. Most crypto exchanges and chart platforms start each daily candle at 00:00 UTC. Some platforms let you choose a different day boundary, which changes the open and close of every daily candle. When comparing charts, check that they use the same one.
US stocks have a regular session from 9:30 a.m. to 4 p.m. Eastern time, and daily candles normally follow it; pre-market and after-hours trading may or may not be shown, depending on the chart settings. Because trading pauses overnight, a stock can open well above or below the previous close, leaving a gap. On a 24/7 crypto chart, each candle usually opens at or very near the previous close.
What a single candle cannot tell you
- The order of events. A candle does not show whether the high came before the low. Two very different days can produce the same shape.
- Who traded, or why. A long lower wick shows that the lowest prices did not last until the close. It does not show who bought or what anyone will do next.
- Its final shape, until the period ends. The current candle keeps changing until it closes. A long wick at midday can be gone by the close.
- The context. The same candle means something different at a well-tested support zone than in the middle of a range.
Common beginner mistakes
- Over-reading one pattern. Named one- and two-candle patterns appear on charts all the time. On their own they are weak evidence; traders who use them usually look for them at a clear level and wait to see what the following candles do.
- Treating colour as the trend. Green only means the close was above that candle’s own open. After a gap down, a green candle can still close below the previous day’s close.
- Mixing timeframes. A strong 5-minute candle can be invisible on the daily chart. Decide which timeframe you are reading before drawing conclusions.
- Comparing different sources. Exchanges, day boundaries and session settings all change the candles, so two charts of the same asset may not match exactly.
For education only, not financial advice. Crypto assets and stocks are volatile, and leveraged positions can lose more than the money you put in.
Get one like this every week
A five-minute market brief in your inbox each Monday. Free, unsubscribe anytime.
Or follow the Telegram channel @isoskwllsMarket now
Latest news


