STX rallies, ether stays boxed in: the daily chart

On this page
STX, the token of Bitcoin layer-2 project Stacks, has climbed more than 50% in four weeks, CoinDesk reported, while the largest coins chop sideways. Ether is the clearest example of that stillness. This article looks at what a small-cap rally does, and does not do, to the ether daily chart.
A small token runs while the majors wait
According to CoinDesk, STX rose nearly 10% in 24 hours and 14% over the week, on top of the four-week gain. In the same report bitcoin was quoted at $83,498.63 and ether at $2,502.87, with the majors described as choppy.
CoinDesk tied the move to interest in Stacks' staking design, which lets BTC holders earn yield on the Bitcoin main chain while keeping control of their own keys. A scheduled step matters here: under Bonding Period 3, set for November, anyone taking part must lock STX worth roughly 5% of the value of the BTC they commit. CoinDesk said that locking pulls STX out of active circulation as more BTC enters the system, and described the design as favouring demand over supply. Yield and lock-ups carry risk: yields can change or disappear, locked tokens cannot be sold quickly, and a small token can fall as fast as it rose.
STX was not alone. CoinDesk listed BDX, REDNER and PYTH as other gainers, each up 6% over 24 hours, and read this as liquidity rotating away from the biggest coins.
Why it matters for ether
Rotation into smaller tokens tells you where short-term attention is going. It says little on its own about the large assets money is leaving or ignoring. For ether, the useful question is simpler: is the chart building a trend, or holding a range while other coins take the spotlight?
CoinDesk's own chart note answers part of that. On the ether daily candlestick chart, it said price had slipped back inside an established consolidation rectangle and was holding near it. A consolidation rectangle is a sideways zone where buyers and sellers have been roughly balanced, with a clear ceiling and floor.
What the chart shows
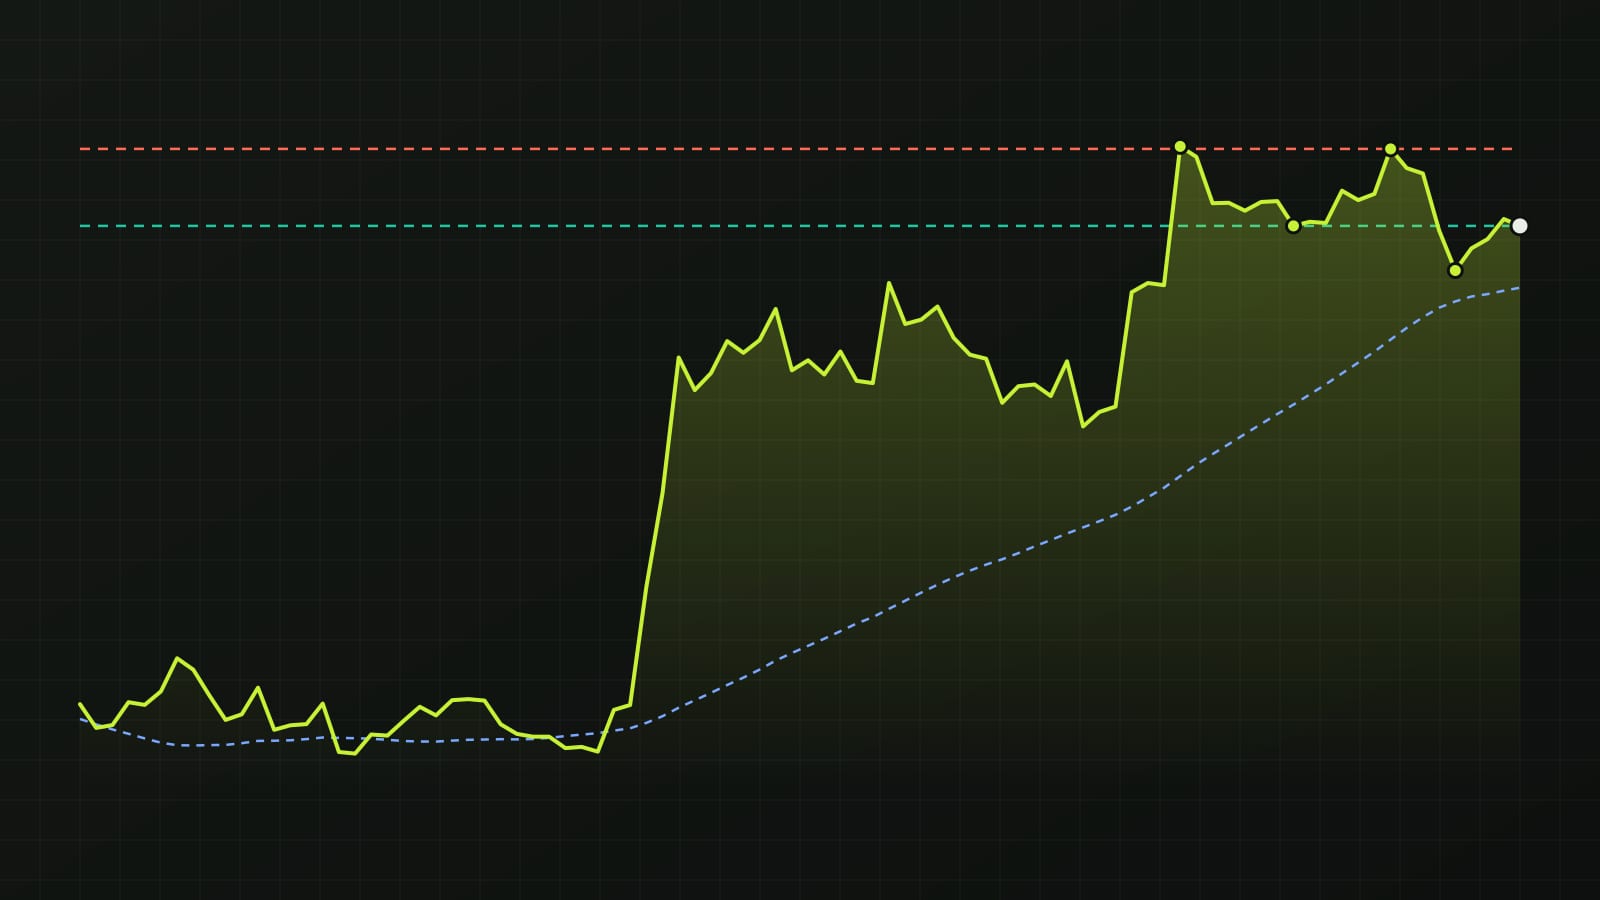
Chartora reads daily closes from Bybit over the last 90 days. Ether closed at $2,503. The structure is a range: there is no clear sequence of higher or lower swings, which matches CoinDesk's description of a rectangle.
Resistance is very close. The nearest swing high on closes is $2,511, from Aug. 27, just 0.3% above price. A swing high is a close that stands above the four closes on each side of it. The nearest support zone is $2,438, a swing low from Sept. 10, 2.7% below price.
Ether trades below its 50-day simple average of $2,558, by 2.2%. The 50-day average smooths out daily noise and shows the recent direction; sitting under it means the last few weeks have leaned soft even inside the range. The longer view is firmer. Over 90 days ether is up 35.9%, and price sits 71% of the way from the 90-day low of $1,842 to the high of $2,776.
So the picture is a market pinned between nearby resistance and a support zone a little further below, with a slightly negative short-term tilt and a positive longer one.
What would change the picture
These are conditions to monitor, not forecasts. Each level is a zone, not a precise line.
- A daily close above the $2,511 zone, and then back above the 50-day average near $2,558, would lift ether out of the lower half of its short-term range. CoinDesk said a break above the top of the rectangle could bring the recent $2,800 high back into view.
- A daily close below the $2,438 support zone would weaken the range reading. CoinDesk named $2,400 as double support, where the range floor meets a bullish channel, and said a break there would end the rally from the July lows.
- Continued closes between those zones would simply extend the range.
Ranges can last longer than traders expect, and breaks from them can fail. That is a risk on both sides of the box.
What to watch next
CoinDesk flagged Wednesday's US CPI report as a likely driver of expectations for Federal Reserve rate decisions, which tends to move the majors more than any single small-cap story. For ether, the closes around $2,511 above and $2,438 below matter most. For STX, the November bonding period is the scheduled event CoinDesk tied to its rally.
Sources
Written with AI assistance from the reports named above and Chartora's own chart data. Figures, quotes and sources are checked automatically before publishing.
For education only, not financial advice. Crypto assets and stocks are volatile, and leveraged positions can lose more than the money you put in.
Get one like this every week
A five-minute market brief in your inbox each Monday. Free, unsubscribe anytime.
Chart notes during the week on Telegram: @isoskwllsMarket now
Latest news