How to Read an Earnings Report: EPS, Guidance and Beats
On this page
Four times a year, US public companies report their results, and their shares can move sharply in the hours that follow. Headlines squeeze a long document into a few words: “beat”, “miss”, “guidance cut”. Knowing where those numbers come from makes the headlines easier to judge.
The report and the filings
Results usually arrive first in a press release, often furnished to the SEC on Form 8-K, with the formal filing following on the same day or later. A company’s fiscal year does not have to match the calendar year, so “the third quarter” can mean different months for different companies.
- Form 10-Q: the quarterly report, filed for each of the first three quarters of the fiscal year. Its financial statements are reviewed by an auditor, not audited.
- Form 10-K: the annual report. It covers the whole fiscal year, includes audited financial statements and a longer discussion of the business and its risks. There is no separate 10-Q for the fourth quarter.
- Both filings are public and free to read on the SEC’s EDGAR database.
Revenue, EPS and diluted EPS
Revenue is what the company took in from selling its products or services. Costs are subtracted step by step until what remains is net income, the profit for the period.
Earnings per share (EPS) divides net income available to common shareholders by the average number of shares outstanding during the period. Diluted EPS also counts shares that could be created from stock options, restricted stock units and convertible securities, so it is the same as or lower than basic EPS.
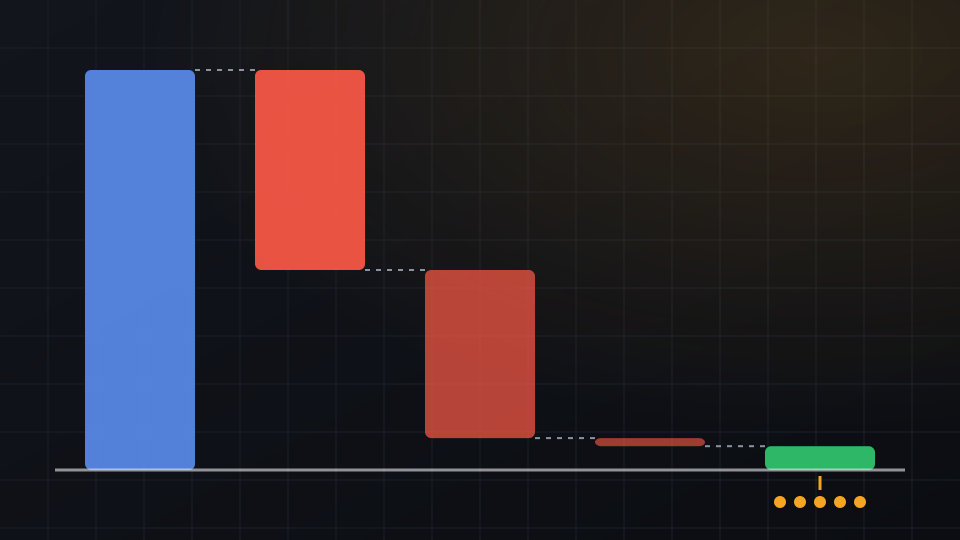
Assume a company reports quarterly revenue of $2.07 billion and net income of $123 million. It had 400 million shares outstanding on average, or 410 million after counting potential shares:
- Basic EPS: $123 million ÷ 400 million = $0.3075, rounded to $0.31.
- Diluted EPS: $123 million ÷ 410 million = $0.30.
Results are usually compared with the same quarter a year earlier, which removes seasonal effects. If the year-ago quarter had revenue of $1.80 billion and diluted EPS of $0.25, revenue grew 15.0% and diluted EPS grew 20.0% year over year.
GAAP and adjusted figures
The financial statements follow GAAP, US generally accepted accounting principles. Many companies also publish adjusted, or non-GAAP, figures that leave out items such as stock-based compensation, restructuring costs or the amortisation of acquired intangible assets.
SEC rules require a company that publishes a non-GAAP measure to also show the most comparable GAAP measure and a reconciliation between the two. In the example, if the company excluded $20.5 million of costs after tax, adjusted EPS would be ($123 million + $20.5 million) ÷ 410 million = $0.35, against $0.30 under GAAP.
Read the reconciliation to see what was left out, and whether the same items are excluded every quarter.
Beat or miss, and guidance
Before each report, analysts publish estimates for revenue and EPS, and data providers average them into a consensus. A beat means the reported figure came in above consensus; a miss means below. Consensus is often built on adjusted EPS, so check which version a headline compares.
Assume consensus for the example company was EPS of $0.28, on the same basis as the reported $0.30, and revenue of $2.10 billion:
- EPS of $0.30 beat consensus by $0.02, or 7.1%.
- Revenue of $2.07 billion missed consensus by $30 million, or 1.4%.
The same report is a beat on one line and a miss on the other.
Guidance is management’s own forecast for the next quarter or the full year, often given as a range. Not every company provides it. For those that do, a change in guidance can matter as much as the quarter just reported, because the share price reflects expectations about the future.
Why shares can fall on a beat
The share price before a report already reflects what investors expect, and those expectations are not always the published consensus. A stock can fall after a beat when:
- the beat was smaller than investors hoped, or came from lower costs or a lower tax rate rather than higher sales;
- revenue or another closely watched line missed, as in the example;
- guidance for the next period came in below expectations;
- margins narrowed, or management sounded less confident on the call.
Many US companies report before the market opens or after it closes. A report released after the close is first traded in after-hours sessions, where volume is thinner and prices can swing more than in regular hours. The first move does not always hold into the next regular session.
Most companies then hold an earnings call, often webcast, where management discusses the results and answers analysts’ questions. What is said on the call can move the shares too.
For education only, not financial advice. Crypto assets and stocks are volatile, and leveraged positions can lose more than the money you put in.
Get one like this every week
A five-minute market brief in your inbox each Monday. Free, unsubscribe anytime.
Or follow the Telegram channel @isoskwllsMarket now
Latest news