CPI, Jobs and Fed Days: Why Scheduled Releases Move Markets
On this page
A handful of US economic releases can move stocks and crypto within seconds. They are not surprises in timing: the dates are published months ahead. What surprises markets is the number itself, compared with what was expected.
Why one number can move everything
Inflation and jobs data shape what investors expect the Federal Reserve to do with interest rates. Rate expectations, in turn, affect how investors value future earnings and how much risk they are willing to hold. Stocks and crypto are both sensitive to that, which is why they often react to the same release at the same moment.
A release does not need to change the economy to move prices. It only needs to change expectations.
The three releases most traders watch
- CPI (Consumer Price Index). Published monthly by the Bureau of Labor Statistics at 8:30 a.m. ET. It measures changes in the prices consumers pay. Traders look at the headline figure and at core CPI, which excludes food and energy, both month over month and year over year.
- The jobs report. The BLS Employment Situation report, also at 8:30 a.m. ET and usually on a Friday early in the month. The best-known figure is nonfarm payrolls, the change in the number of jobs. The report also includes the unemployment rate and average hourly earnings, and it revises the payroll figures for the two previous months.
- FOMC meetings. The Fed’s Federal Open Market Committee holds eight scheduled meetings a year. The policy statement is released at 2:00 p.m. ET on the final day, and the Fed Chair holds a press conference at 2:30 p.m. Four of the meetings also come with the Summary of Economic Projections, which includes officials’ projections for interest rates. Minutes follow three weeks later.
ET is US Eastern time, which shifts with daylight saving. That is one reason to rely on a calendar that converts times for you.
Consensus, actual and the surprise
Before each release, data providers collect economists’ forecasts and publish a typical value, usually called the consensus. Markets have largely priced that number in before it arrives. The reaction comes from the gap between the consensus and the actual figure.
A hypothetical example: if the consensus for payrolls is +150,000 jobs and the report shows +90,000, the surprise is 60,000 jobs below expectations. If the consensus for monthly CPI is 0.3% and the actual is 0.5%, inflation came in 0.2 percentage point above expectations. A number that sounds healthy on its own can still be a disappointment if the market expected more.
- Look beyond the headline. Core CPI, wage growth or revisions to earlier months can matter as much as the main figure.
- For the Fed, the words count. A rate decision is often fully expected. Changes in the statement’s wording, the projections and the press conference can move markets more than the decision itself.
- The same surprise does not always get the same reaction. It depends on what the market was already worried about.
What happens around the release
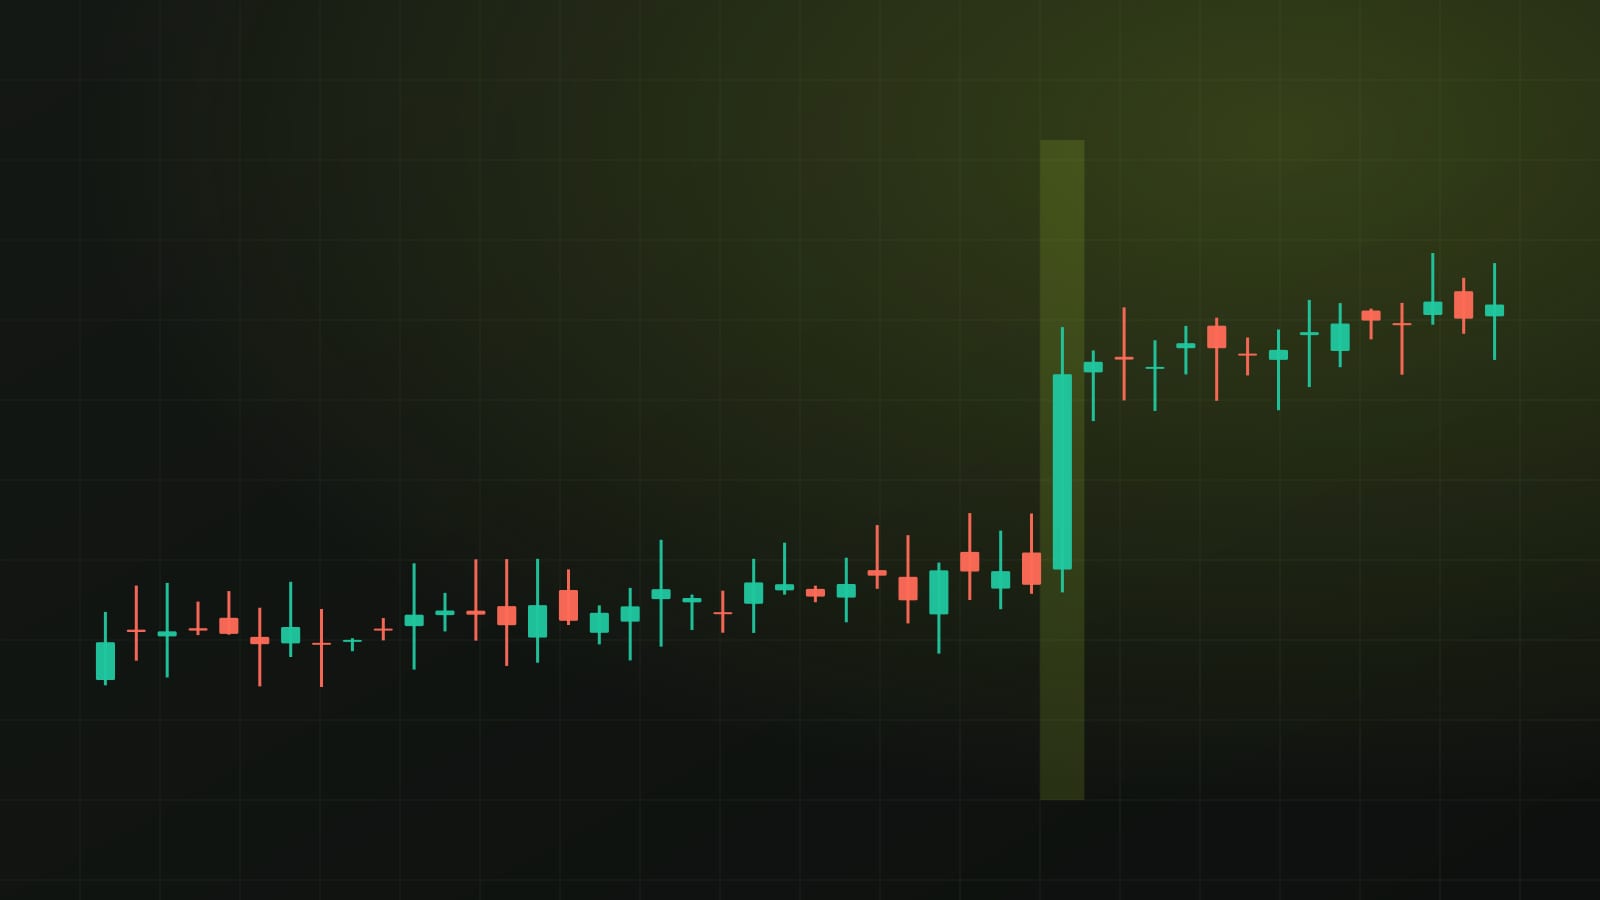
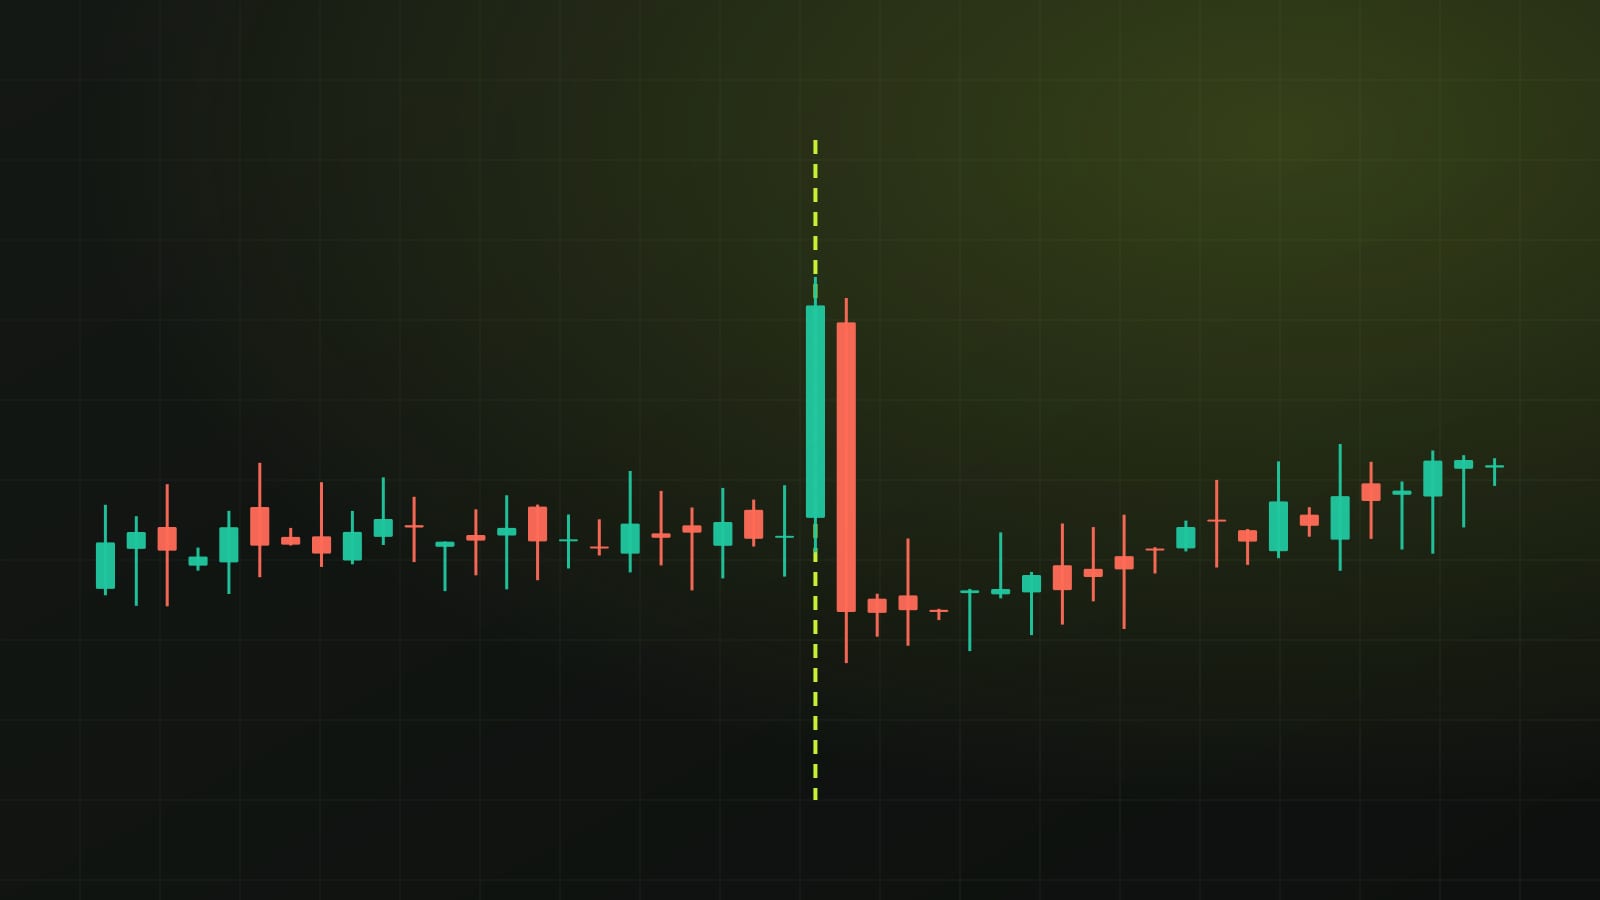
In the minutes before a release, many traders step back, so there are fewer orders on the book. When the number appears, price can jump several times its normal range in one candle. The first move often reverses, sometimes more than once, before a direction settles.
Timing matters too. CPI and jobs data arrive at 8:30 a.m. ET, an hour before the regular US stock session opens at 9:30. Stock index futures and crypto, which trade at that hour, react first. The FOMC statement lands during the session, and the press conference can bring a second wave.
Fast markets are where leveraged positions get hurt most. Stop orders can fill far from their set price, and liquidations tend to cluster around these minutes.

Using the calendar in the Data room
Chartora’s Data room includes an economic calendar provided by TradingView. It lists releases from the US, the euro area, the UK, Japan and China, and shows every time in your own time zone, so you do not have to convert from ET.
- Check the week ahead. Note which days carry CPI, jobs or an FOMC decision before you look at a chart.
- Read the forecast and the previous value. Entries usually list the actual figure next to a forecast and the prior reading, so you can see the size of the surprise as soon as it is published.
- Mark release times on your chart. A sharp candle at 8:30 a.m. ET is usually news, not a new trend.
- Give the first move time. Many traders wait for the first few candles to close before reading direction.
For education only, not financial advice. Crypto assets and stocks are volatile, and leveraged positions can lose more than the money you put in.
Get one like this every week
A five-minute market brief in your inbox each Monday. Free, unsubscribe anytime.
Or follow the Telegram channel @isoskwllsMarket now
Latest news