S&P 500, Nasdaq-100 and Dow: What Each Stock Index Measures
On this page
“Stocks rose today” usually means one of three indices went up. The S&P 500, the Nasdaq-100 and the Dow each track a different group of companies, and they add them up in different ways. Knowing the difference helps you read the headline correctly.
What an index is
A stock index turns the prices of a group of stocks into one number. The level itself is arbitrary: an index at 20,000 is not “higher” than one at 2,000 in any useful sense. What matters is the percentage change, and which stocks drive it.
Two things define an index: which companies are included and how much weight each one gets. The three best-known US indices answer both questions differently.
The three indices side by side
- S&P 500. About 500 leading large US companies, covering roughly 80% of the available US stock market value, according to S&P Dow Jones Indices. Each company is weighted by its float-adjusted market capitalization: the value of the shares available to the public. An index committee selects members using published eligibility criteria. Some companies have more than one share class listed, so the index holds slightly more than 500 stocks.
- Nasdaq-100. 100 of the largest non-financial companies listed on the Nasdaq Stock Market, so banks are excluded. It uses modified market-cap weighting: weights follow company size, with rules that limit how large the biggest weights can become. It is heavy in technology but also includes other sectors. Note that “the Nasdaq” in news headlines often means the Nasdaq Composite, a much broader index of Nasdaq-listed stocks.
- Dow Jones Industrial Average. 30 large US companies, chosen by a committee without fixed numerical rules. It is price-weighted: a stock with a higher share price counts for more, whatever the size of the company. Despite the name, it is no longer limited to industrial companies.
Why weighting changes what a 1% move means
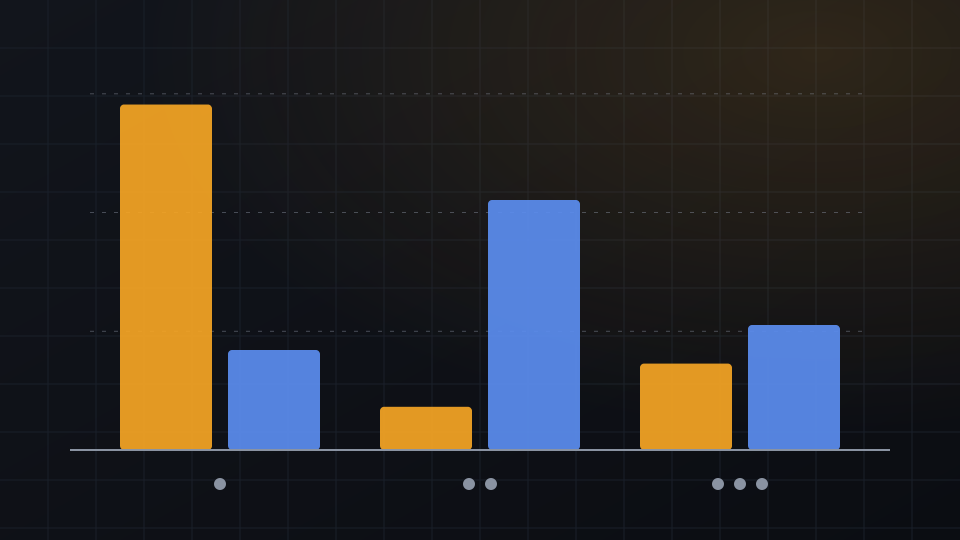
A hypothetical index of three companies shows the difference. Company A trades at $400 with 1 billion shares, a market value of $400 billion. Company B trades at $50 with 20 billion shares, $1,000 billion. Company C trades at $100 with 5 billion shares, $500 billion.
In a price-weighted index, weights follow the share price: A is 72.7%, B 9.1% and C 18.2%. In a cap-weighted index, weights follow market value: A is 21.1%, B 52.6% and C 26.3%. The largest company in the group has the smallest weight under price weighting.
Now let one stock rise 10% while the others stay flat. If A rises, the price-weighted index gains 7.27% and the cap-weighted index 2.11%. If B rises, the price-weighted index gains 0.91% and the cap-weighted index 5.26%. Same move, very different headline.
Price weighting has another quirk: a $1 change in any stock moves the index by the same amount, here 0.18%, whether the company is large or small. That is also why a stock split reduces a company’s influence in the Dow even though nothing about the business has changed.
Indices versus the ETFs and futures that track them
You cannot buy an index directly. Exchange-traded funds hold the stocks in an index and aim to match its return: for example, SPY, IVV and VOO track the S&P 500, QQQ tracks the Nasdaq-100 and DIA tracks the Dow. These are examples, not recommendations.
- The price is not the index level. An ETF’s share price is a different number from the index it tracks.
- Returns differ slightly. Fund fees and the handling of dividends mean an ETF’s return will not match the index exactly. The headline index levels track prices only and leave dividends out.
- Futures trade longer hours. Index futures, such as the E-mini contracts on the S&P 500 and Nasdaq-100, trade almost around the clock on weekdays. They show the market’s reaction to early-morning news before the regular session opens.
Why crypto traders watch these indices
Bitcoin and other large coins often react to the same forces as US stocks: interest-rate expectations, economic data and shifts in how much risk investors want to take. Many crypto traders compare with the Nasdaq-100 in particular, because of its weight in large growth companies.
The relationship is not fixed. There are stretches when crypto and stock indices move closely together and stretches when they part ways. Checking the S&P 500 or Nasdaq-100 next to a crypto chart helps you see whether a move is specific to crypto or part of a broader market swing. It does not tell you what either will do next.
For education only, not financial advice. Crypto assets and stocks are volatile, and leveraged positions can lose more than the money you put in.
Get one like this every week
A five-minute market brief in your inbox each Monday. Free, unsubscribe anytime.
Or follow the Telegram channel @isoskwllsMarket now
Latest news