RSI explained: what the 70 and 30 lines really mean

On this page
The Relative Strength Index, or RSI, is the oscillator most chart platforms show by default, usually with lines at 70 and 30. Those lines are often read as “sell” and “buy”. They mean something narrower than that.
Where RSI comes from
RSI was introduced by J. Welles Wilder Jr. in his 1978 book New Concepts in Technical Trading Systems. It compares the size of recent up moves with the size of recent down moves and scales the result from 0 to 100.
Wilder used a lookback of 14 periods, which is still the default on most platforms. On a daily chart, that means the last 14 changes from one close to the next.
How it is calculated
Take the change from each close to the next over the lookback. Average the gains, counting down days as zero, and average the losses, counting up days as zero. Divide the average gain by the average loss; that ratio is called RS. Then RSI = 100 − 100 ÷ (1 + RS).
Assume that over 14 days a price rose on 9 days, by a total of $14, and fell on 5 days, by a total of $7. The average gain is $14 ÷ 14 = $1.00 and the average loss is $7 ÷ 14 = $0.50. RS is 2, so RSI = 100 − 100 ÷ 3 ≈ 66.7.
That first reading uses simple averages, which is how Wilder’s method sets its starting values. After that, Wilder smooths the averages: each day, the new average is the previous one times 13, plus today’s gain or loss, divided by 14. If the next day adds a $2 gain, the average gain becomes about $1.07, the average loss about $0.46, and RSI rises to about 69.8.
What 70 and 30 actually measure
Wilder treated readings above 70 as overbought and below 30 as oversold. In plain terms, an RSI of 70 means the average gain over the lookback was about 2.33 times the average loss. That describes strong recent buying. It does not say the buying is about to stop.
- Above 70: gains have clearly outweighed losses over the lookback.
- Around 50: gains and losses have been roughly equal in size.
- Below 30: losses have clearly outweighed gains.
- At the extremes: if every day in the window was up, the average loss is zero and RSI is 100; if every day was down, RSI is 0.
“Overbought” is a description of the last 14 periods, not a forecast. A market can stay above 70 while it keeps rising, and below 30 while it keeps falling.
RSI in strong trends
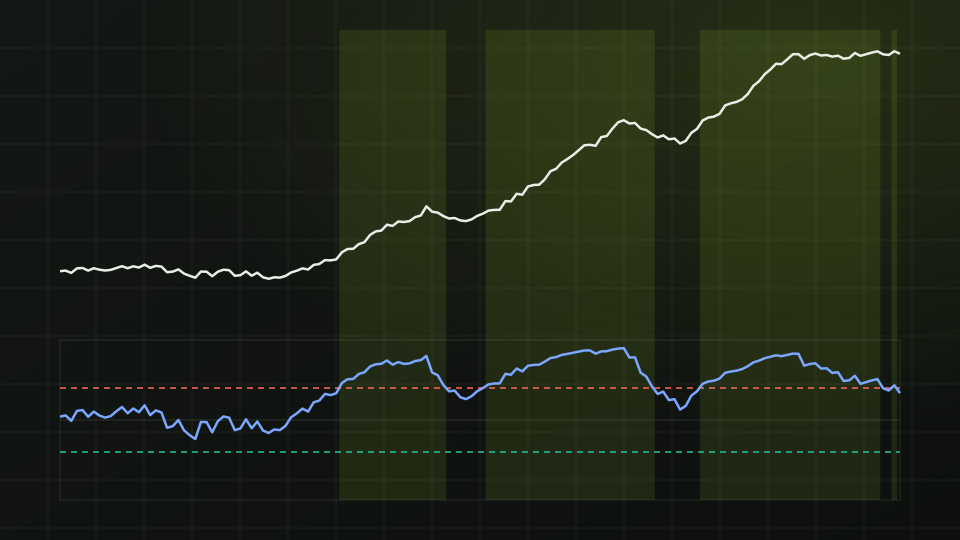
Strong trends are exactly when RSI stays stretched. In a steady uptrend, pullbacks are small and short, so the average loss stays low and RSI can spend weeks above 70. Treating every move above 70 as a reason to sell means repeatedly betting against the trend.
Some traders read RSI differently in a trend: in an uptrend they watch whether it holds around the middle of its range on pullbacks, rather than waiting for it to reach 30. That is a way of reading momentum, not a rule.
Divergence and its limits
A divergence is when price and RSI disagree. In a bearish divergence, price makes a higher high but RSI makes a lower high: the new high came with less upward momentum. A bullish divergence is the mirror image, a lower low in price with a higher low in RSI.
Divergences are worth noticing and easy to over-read. In a long trend RSI can diverge several times while price keeps going, and a divergence says nothing about when, or whether, a turn will come. Many traders use it as a reason to watch price structure more closely, such as whether the last higher low breaks, rather than as a signal in itself.
For education only, not financial advice. Crypto assets and stocks are volatile, and leveraged positions can lose more than the money you put in.
Get one like this every week
A five-minute market brief in your inbox each Monday. Free, unsubscribe anytime.
Or follow the Telegram channel @isoskwllsMarket now
Latest news


